

Take a breath. You have just opened the very first chapter of your Class 10 Economics book — Understanding Economic Development, Chapter 1 — and the title is a single, slightly intimidating word: Development. Maybe you have already flipped through it and thought, “This is all just talking. Where are the rules? What am I supposed to memorise?” That feeling is completely normal, and it is also a little bit misleading, because this chapter has more structure hiding inside it than almost any other chapter in your Social Science book.
Here is the honest truth about this chapter: it is half a discussion and half a maths problem. The discussion half asks you to think about what a good life actually looks like for different kinds of people. The maths half asks you to calculate averages, per capita incomes, infant mortality rates and literacy rates, and then to argue about what those numbers do and do not tell you. Students who treat it as “only theory” lose marks on the numericals. Students who treat it as “only sums” lose marks on the reasoning. We are going to do both, slowly, and by the end you will be comfortable with both halves.
I want you to picture something before we start. Imagine four people standing on a road: a landless farm labourer, a girl studying in Class 10, a factory owner, and a farmer who owns a small piece of land near a river. Ask each of them, “What would make your life better?” You will get four completely different answers. Not one of them is wrong. That single observation — different people have different developmental goals — is the seed from which this entire chapter grows. Everything else, including per capita income and the Human Development Index, is just humanity trying to measure something that different people define differently.
This chapter sits in the Economics unit of the CBSE Class X Social Science curriculum 2026-27, where it is the first chapter of Understanding Economic Development and is allotted 12 periods of teaching time. The Economics section as a whole carries 20 marks in your board paper. Twelve periods for one chapter is a lot — CBSE is telling you plainly that this chapter matters. And because it is the foundation chapter, the ideas here (income, standard of living, public facilities, sustainability) come back again in the chapters on sectors of the economy, money and credit, and globalisation.
So settle in. I am going to sit beside you and explain each idea as if we had all afternoon. Read slowly. Do the sums with a pencil in your hand. And whenever a paragraph starts to feel slippery, stop and read it once more before moving on — this chapter builds, and a shaky first floor makes a shaky building.
What You’ll Learn
Jump straight to any section — or read top to bottom the first time.
- What Development Means: Different People, Different Goals
- Income And Other Goals: Why Money Is Not The Whole Story
- National Development: Whose Idea Counts?
- Comparing Countries: Average Income And Per Capita Income
- The Limitations Of Average Income
- Beyond Income: Health, Education And Other Criteria
- Public Facilities And Why Income Alone Cannot Buy Them
- The Human Development Index And The Human Development Report
- Sustainability Of Development
- How To Answer Development Questions In The Board Exam
- Practice Worksheet With Answers
Your Game Plan
Do not try to swallow this chapter in one sitting. Here is the order that works best for almost every student I have taught:
- Read the first three sections slowly (different goals, income and other goals, national development). These are about thinking, not memorising. Argue with them in your head.
- Master the arithmetic next. Average income and per capita income are just division. Do every worked example with a pencil before reading the solution.
- Learn the four indicators cold — per capita income, infant mortality rate, literacy rate, net attendance ratio. Know what each measures and how each is calculated.
- Understand the criticism — why averages hide things, why income cannot buy public facilities. This is where 5-mark questions live.
- Finish with HDI and sustainability. These are the “big picture” sections and they make far more sense once the earlier ideas are solid.
- Then do the worksheet at the end with your book closed. Only then check the answers.
What Development Means: Different People, Different Goals
Let us begin with the word itself. In everyday Hindi or English conversation, “development” (vikas) usually means new roads, tall buildings, factories, metro lines. That is what the newspapers show. But in Economics, development means something wider and gentler: the changes people wish for in their lives so that they can live better. Notice the two words doing all the work in that sentence — “people” and “wish”. Development is defined by what human beings actually want, not by what looks impressive from a helicopter.
And here is where the chapter gets interesting. Because different people are in different situations, they wish for different things. Economists call these wishes developmental goals or development goals. A developmental goal is simply the answer to the question, “What would count as my life getting better?”
Think about your own home for a second. If you asked your grandmother what would improve her life, she might say a hospital nearby with a doctor who is actually present. Ask a young cousin who just finished Class 12 and she might say a good college and a job in her own city. Ask a shopkeeper and he might say fewer power cuts and better roads so customers can reach him. Same street, same town, three different definitions of “better”. None of them is being unreasonable — each is answering honestly from where they are standing.
Let me show you this properly with a table. Read it slowly and notice the pattern — each person wants the thing their situation denies them.
| Category of person | What development would mean to them | Why (the situation behind the wish) |
|---|---|---|
| Landless rural labourer | More days of work in the year, a higher daily wage, a small plot of land of his own, schooling for his children | He owns no land, so his income depends entirely on someone else hiring him. Work is seasonal and uncertain. |
| Prosperous farmer from a well-irrigated village | A higher support price for his crop, cheap labour available at harvest time, better storage and transport to the market | He already produces plenty; his worry is the price he gets and the cost of producing it. |
| Farmer who depends only on rain | A canal or tube well so that irrigation does not depend on the monsoon | One failed monsoon can wipe out an entire year’s income. Water security is survival. |
| A girl from a conservative household | Freedom to continue studying, to choose her own career, to move about safely, to be treated as equal to her brother | Her constraint is not money at all — it is restriction and unequal treatment. More income in the house does not automatically remove it. |
| Owner of a small industrial unit | Reliable electricity, easy bank loans, good roads, more customers with money to spend | His growth is blocked by infrastructure and credit, not by lack of skill. |
| Urban unemployed youth | A secure job with a regular salary, affordable rent, and skills training | He may be educated but the jobs available do not match his training. |
Illustrative table built for teaching. The categories are the standard ones discussed in Class 10 Economics; the wordings are our own.
Why this works. A person’s developmental goal is basically the gap between where they are and where they want to be. The landless labourer’s gap is employment. The rain-fed farmer’s gap is water. The girl’s gap is freedom and respect. So if you are ever asked in an exam to state the developmental goals of some category of person, do not memorise a list — just ask yourself, “What is missing in this person’s life?” The answer writes itself.
Now look at that table one more time, but this time look for collisions. Do you see any two rows where one person getting what they want makes life worse for another person in the table?
Look at rows one and two. The landless labourer wants a higher daily wage. The prosperous farmer wants cheap labour at harvest time. These are the same thing seen from opposite sides of a field, and they point in opposite directions. If the labourer’s wish comes true, the farmer’s cost goes up. If the farmer’s wish comes true, the labourer stays poor. This is what the chapter means when it says that developmental goals can be conflicting — not merely different, but actively opposed.
Conflicting goals = one person achieving their goal directly harms another (higher wages vs cheap labour; a dam’s electricity vs the displaced family’s home). They cannot both be fully achieved. Examiners love this distinction — use the word “conflicting” only when there is a genuine clash.
The most famous example of conflicting goals in this chapter is the dam. Imagine a large river valley project. It will generate electricity for a whole region and provide irrigation water to thousands of hectares of farmland downstream. For the city that gets the power and the farmers who get the water, this is unmistakably development. But the reservoir will submerge villages upstream. The families living there will lose their houses, their fields, their temples, the graves of their ancestors and the community they have known all their lives. For them, the very same project is a catastrophe. They are asked to pay the price for someone else’s development.
I want you to hold both halves of that story in your head at once, because that is exactly the maturity the board exam is testing. A weak answer says “dams are good” or “dams are bad”. A strong answer says: the same activity can be development for one group and destruction for another, which is why decisions about development must consider who gains and who loses, and must compensate and rehabilitate those who lose.
Model answer with mark-by-mark annotation:
(1 mark) More days of employment. A landless labourer owns no land of his own, so he can earn only when a landowner hires him. Farm work is seasonal, so for several months of the year he may find no work at all. Regular employment through the year is therefore his first goal.
(1 mark) Higher wages. Even on the days he works, the daily wage may be too low to feed his family properly. A better wage rate would directly raise his standard of living.
(1 mark) Education and health facilities for his children. He wants his children to study so that the next generation is not trapped in the same insecure work, and he wants a health centre nearby because a single illness can push the family into debt.
What earned the marks: notice that each point has two parts — the goal (a short phrase) and the reason (one sentence explaining the situation). One-word answers like “money, work, school” would score much less. Always write goal + reason.
Model answer:
(1 mark for the statement) Different sections of society are placed differently, so an activity that improves life for one group may damage life for another. Such goals are called conflicting developmental goals.
(1 mark, example one) Wages and labour costs. A rural labourer’s goal is a higher daily wage, while a large farmer’s goal is to get labour cheaply at harvest time so that his costs stay low. If the labourer’s wage rises, the farmer’s profit falls. Both cannot get exactly what they want.
(1 mark, example two) An industrial project or a dam. A new factory or a big dam brings jobs, power and irrigation for one region, but the families whose land is acquired or submerged lose their homes and livelihoods. What is development for the beneficiaries is displacement for those who are moved.
Examiner’s eye: the word “conflicting” must appear, and each example must clearly show both sides — who gains and who loses. If you only describe the gain, you have not proved the conflict.
Before you move on, try this in your head: what would development mean to a fisherman on a coast where a new port is being built? He may gain a market and better transport, but he may also lose his fishing ground. Sit with the discomfort of that answer for a moment — that discomfort is the chapter.
Income And Other Goals: Why Money Is Not The Whole Story
Let us be fair to money before we criticise it. Income matters enormously, and any answer that dismisses it is a bad answer. Ask yourself why people migrate hundreds of kilometres to a city, why parents push children towards certain careers, why a family celebrates when someone gets a government job. Behind all of it is a simple truth: more income buys more of the things a person needs and wants. Food, medicines, a pucca house, a school fee, a bus fare, a phone, a doctor’s consultation — almost every material need is purchased with money.
So the chapter says clearly: income is one of the most important goals of development. People look for regular work, better wages and reasonable prices for the goods they sell. That is not greed. That is the ordinary, dignified desire to be secure.
And yet. Sit with the following three little stories.
- The transfer. A woman is offered a job with a much higher salary in a distant city. She refuses it because her children’s school and her elderly mother are here. More income, but less of what she values.
- The daughter-in-law. A family becomes wealthy. The daughters-in-law still cannot go out without permission, still cannot take up jobs, still have no say in decisions. Household income has risen; their freedom has not moved an inch.
- The polluted colony. A worker earns a good salary in a factory town where the air is thick and the water is contaminated. His bank balance grows while his lungs get worse.
In each story income went up but life did not clearly get better. Something else was missing. That “something else” is what economists call non-material goals or quality of life — things that money either cannot buy at all, or cannot buy for you alone.
Why this works — the deeper reason. Money is a means, not an end. You do not want a five-hundred-rupee note for its own sake; you want what it can be exchanged for. So the moment a thing you value cannot be exchanged for money, income stops helping. You cannot buy your neighbours’ respect. You cannot buy an unpolluted sky over your own house only. You cannot buy your daughter the right to be treated as an equal at her in-laws’ home. Those things depend on how society is organised, not on your bank balance. That is the single most important sentence in this section — underline it.
There is a subtler point too, and it separates a 4-mark answer from a 5-mark answer. Some non-material goals are collective — they exist only if everyone has them. Safety on the street is a good example. A rich family can hire a guard for the house, but the moment they step outside, their safety depends on the general safety of the neighbourhood. Clean air is the purest example of all: you literally breathe the same air as the poorest person in your locality. These collective goods cannot be purchased individually, and we will return to this idea in the section on public facilities.
Model answer, structured for five marks:
(Mark 1 — accept the first half honestly) Income is genuinely important. With a higher income a person can buy nutritious food, medicines, better clothing and a safer house, and can pay for the education of children. Most material needs are met through money, which is why people everywhere seek regular work and better wages.
(Mark 2 — equal treatment) However, many things people value cannot be purchased. A woman may belong to a wealthy family and still not be allowed to take up a job or make her own decisions. Her problem is unequal treatment, and no amount of family income removes it.
(Mark 3 — freedom and security) People also want the freedom to choose their occupation and the security of a stable job. A worker in an insecure daily-wage job may earn reasonably well in good months yet live in constant anxiety, because he can be dismissed any day.
(Mark 4 — respect and dignity) Being treated with respect by others matters deeply. A person who faces discrimination because of caste, religion or gender does not feel developed even if his income is adequate.
(Mark 5 — collective goods, the clinching point) Finally, some things simply cannot be bought individually because they must be shared. Pollution-free air and disease-free surroundings cannot be purchased for one household alone; safety on the roads cannot be bought privately. These depend on how the whole society and its government act.
Conclusion sentence: Hence development must be judged by both material and non-material improvements in people’s lives.
Annotation: Five distinct ideas, each with an illustration, and a one-line conclusion. That is the shape of a full-mark 5-marker.
| Material goals (money can help) | Non-material goals (money cannot buy, or cannot buy alone) |
|---|---|
| Nutritious food, clean drinking water | Equal treatment regardless of gender, caste or religion |
| A pucca house with electricity | Freedom to choose one’s occupation and way of life |
| Fees for school and college | Security of job and of life |
| Medicines and private treatment | Respect and dignity in the eyes of others |
| Vehicles, phones, appliances | Pollution-free air and disease-free surroundings |
| Savings for old age | Friendship, family support, a sense of belonging |
National Development: Whose Idea Counts?
So far we have talked about individuals. Now zoom out. When we say “India should develop”, whose picture of a better life are we actually talking about? This is the question of national development, and it is a genuinely hard one — hard in a way that Class 10 students often underestimate.
Here is why it is hard. A country is not one person with one wish. It is a hundred and forty crore people, each with their own developmental goals, many of them conflicting. When the government decides to build a new expressway, an airport, a steel plant or a large dam, it is effectively choosing one group’s version of development and asking others to adjust. So the honest question is not “what is development?” but “whose development, decided by whom, and at whose cost?”
Let me give you a small analogy that students find helpful. Imagine your class has to choose one activity for the annual day. Thirty students want a dance performance, ten want a play. If you simply go by the majority, the dance wins. But suppose the ten who wanted the play are the only ones who will not get any other chance to perform all year. Is “majority wins” the fair answer, or is there something more you should think about? A country faces exactly this dilemma, only the stakes are homes and livelihoods rather than a stage.
Test 2 — Is it fair to those it does not help? Even a decision that benefits the majority must not crush a minority. Those who lose must be properly compensated, rehabilitated and given a genuine hearing before the decision is taken.
A truly national idea of development satisfies both tests. Writing only the first test is the commonest way students lose the second mark.
Why this works. Democracy gives us the first test almost automatically — governments must please large numbers of voters to stay in power. But the first test alone can be brutal, because a majority can always outvote a minority. That is why the second test exists. If ten thousand families are displaced so that a million people get electricity, the arithmetic looks fine but the justice does not, unless those ten thousand families are properly resettled and consulted. Development that is procedurally fair — where affected people were actually asked — tends to be more durable than development imposed from above, because it does not leave behind a permanent grievance.
Model answer:
(1 mark) Since people’s situations differ, their developmental goals differ and sometimes directly conflict — for example, a labourer wants higher wages while a large farmer wants cheap labour. A country therefore cannot adopt every notion at once.
(1 mark) Generally, a country adopts the notion that is beneficial to a large number of its people, since national development should improve the lives of the majority rather than a narrow section.
(1 mark) However, a decision that helps the majority may harm a minority, so it should also be just and fair. Those who are adversely affected — for instance, families displaced by a project — must be consulted, compensated and rehabilitated. National development must combine the greatest good of the greatest number with fairness to those who lose.
Annotation: Point 1 sets up the problem, point 2 gives the majority test, point 3 gives the fairness test. Skipping point 3 typically costs one full mark.
Comparing Countries: Average Income And Per Capita Income
Now we shift gears. Put the discussion aside and pick up a pencil, because this section is arithmetic — and it is genuinely easy arithmetic once you see what is going on.
Here is the problem economists faced. Suppose you want to compare two countries and say which one is “more developed”. You cannot interview everybody. You need a single number that summarises each country. What number should it be?
The first idea is total income — add up everything everyone in the country earns in a year. But total income is a terrible comparison tool, and I want you to see exactly why. Imagine a country with 100 crore people and a total income of ₹200 lakh crore, and a small country with 1 crore people and a total income of ₹50 lakh crore. The first country has four times the total income. Does that mean its people are four times better off? Absolutely not — the first country has to share that income among a hundred times as many people. In fact its people are much worse off individually.
Per capita income is simply another name for average income. (“Per capita” is Latin for “per head”.)
In symbols: Per capita income = Total income ÷ Total population
Because countries have different populations, we compare average incomes, not total incomes. This one sentence is a guaranteed mark whenever the question asks why total income is not used.
Why this works. Dividing by population is a way of asking, “If this country’s entire income were shared out equally, how much would each person get?” That is a fair-ish way to compare two countries of very different sizes, in the same way that you would compare two families by looking at income per member rather than total household income. A family of eight earning ₹80,000 a month is not richer than a family of two earning ₹60,000 a month, even though ₹80,000 is the bigger number.
Step 1 — add everything up.
₹18,000 + ₹22,000 = ₹40,000
₹40,000 + ₹31,000 = ₹71,000
₹71,000 + ₹9,000 = ₹80,000 (total monthly income)
Step 2 — divide by the number of units.
Number of families = 4
Average = ₹80,000 ÷ 4 = ₹20,000 per family per month
Notice something already. Not one of the four families actually earns ₹20,000. Two earn less, two earn more. The average is a useful summary, but it describes no real family. Hold on to that thought — it becomes the whole of the next section.
Step 1 — write the formula. (Always write it. It is often worth half a mark by itself.)
Per capita income = Total income ÷ Total population
Step 2 — substitute, keeping the units matched. Both figures are in crore, so the “crore” cancels neatly:
Per capita income = 1,50,00,000 ÷ 125
Step 3 — divide.
1,50,00,000 ÷ 125 = ₹1,20,000
Answer: The per capita income of Vindhyapur is ₹1,20,000 per year.
Check it backwards (do this every single time): ₹1,20,000 × 125 crore = 1,50,00,000 crore. ✓ It matches the total we started with, so the answer is right.
Think first. The formula is PCI = Total ÷ Population. To get Total, multiply both sides by Population:
Total income = Per capita income × Population
Substitute:
Total income = ₹1,80,000 × 5 crore = ₹9,00,000 crore
Answer: ₹9,00,000 crore per year.
Why examiners like this version: it checks whether you understand the formula or have merely memorised “divide”. Whenever the question gives you two of the three quantities (total income, population, per capita income), you can always find the third. Rearranging is not extra knowledge — it is the same one formula.
Now, who actually does this comparing on a world scale? The best-known classification comes from the World Bank, which publishes the World Development Report every year. The World Bank sorts countries into income groups using their per capita income, measured in US dollars so that all countries are on a common scale.
Broadly, the World Bank’s ladder has these rungs: low-income countries at the bottom, then lower-middle-income, then upper-middle-income, and high-income (often loosely called “rich” or “developed”) countries at the top. India currently sits in the middle-income range — it is neither a low-income country nor a high-income one. That placement is the fact worth knowing; the exact dollar figure is not.
Your NCERT textbook quotes cut-offs from a particular edition of the World Development Report (the widely circulated printing uses the 2021 report, which was based on 2019 data). Look up the exact figures in your own copy of the textbook and use those in the exam, because the board’s answer key follows the textbook edition. Do not trust a number you half-remember from the internet, and do not quote a figure as though it were today’s value.
What you should carry in your head instead, because it never goes stale: the World Bank ranks countries by per capita income in US dollars; countries above a high threshold are called high-income or rich, those at or below a low threshold are called low-income, and India lies in the middle-income group. That sentence will earn the mark in any year.
Two more small but examinable points about the World Bank’s method.
- Why US dollars? Because incomes in different countries are earned in different currencies — rupees, yen, euros, pesos. To place them on one scale you must convert them all into a common currency, and the US dollar is the conventional choice.
- Why “per annum”? Per capita income is always stated for a full year, so a country with a seasonal economy is not judged by a good month or a bad one.
| Country | Total income (₹ crore) | Population (crore) |
|---|---|---|
| Amarpur | 6,00,000 | 4 |
| Banipur | 2,40,000 | 3 |
| Chandrika | 9,00,000 | 10 |
| Dhaneshwar | 1,20,000 | 2 |
Amarpur: 6,00,000 ÷ 4 = ₹1,50,000
Banipur: 2,40,000 ÷ 3 = ₹80,000
Chandrika: 9,00,000 ÷ 10 = ₹90,000
Dhaneshwar: 1,20,000 ÷ 2 = ₹60,000
Ranking (highest per capita income first): Amarpur (₹1,50,000) → Chandrika (₹90,000) → Banipur (₹80,000) → Dhaneshwar (₹60,000).
The lesson buried in this sum: Chandrika has by far the largest total income (₹9,00,000 crore) yet ranks only second on per capita income, and Amarpur, with two-thirds of Chandrika’s total income, comes first. This is precisely why the World Bank uses per capita income and not total income. If a question ever asks you to justify that choice, this example is your proof.
1. Writing “average income = total income ÷ total families”. It is ÷ total population, not families.
2. Forgetting the units. Write ₹ and “per year” — a bare number can lose the final half mark.
3. Mixing up crore and lakh while dividing. Convert everything to the same unit before you divide, and always verify by multiplying back.
The Limitations Of Average Income
You already caught the problem in Example 5, when the average was ₹20,000 and not a single family actually earned ₹20,000. Let us now turn that small observation into the most important criticism in the whole chapter.
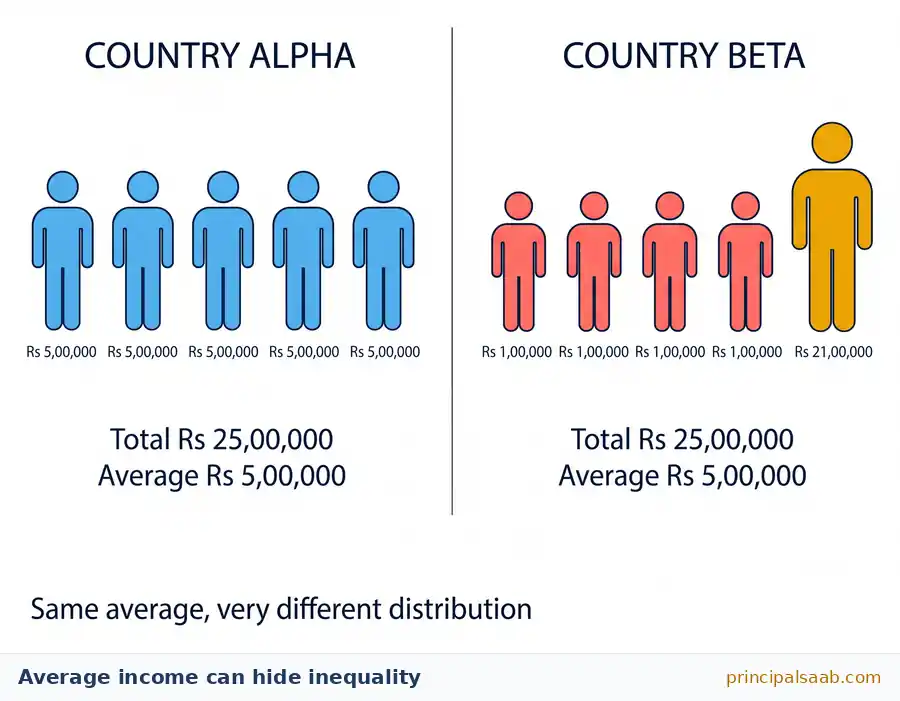
An average is a flattening device. It takes a crowd of very different numbers and squashes them into one. That is exactly what makes it useful, and exactly what makes it dangerous. Useful, because one number is easy to compare. Dangerous, because the one number does not tell you how the income is spread out. Two countries can have identical per capita incomes and utterly different lives inside them.
Let me build you the cleanest possible proof of this. We will use two imaginary countries with only five citizens each, so that you can see every rupee.
| Citizen | Country Alpha (₹) | Country Beta (₹) |
|---|---|---|
| Citizen 1 | 5,00,000 | 1,00,000 |
| Citizen 2 | 5,00,000 | 1,00,000 |
| Citizen 3 | 5,00,000 | 1,00,000 |
| Citizen 4 | 5,00,000 | 1,00,000 |
| Citizen 5 | 5,00,000 | 21,00,000 |
| Total | 25,00,000 | 25,00,000 |
| Average (per capita) | 5,00,000 | 5,00,000 |
Step 1 — Country Alpha.
Total = 5,00,000 × 5 = ₹25,00,000
Average = 25,00,000 ÷ 5 = ₹5,00,000
Step 2 — Country Beta.
Total = 1,00,000 + 1,00,000 + 1,00,000 + 1,00,000 + 21,00,000
= 4,00,000 + 21,00,000 = ₹25,00,000
Average = 25,00,000 ÷ 5 = ₹5,00,000
Step 3 — compare. The two averages are identical: ₹5,00,000 each.
Step 4 — now look inside.
• In Alpha, every single citizen actually earns ₹5,00,000. Nobody is poor and nobody is exceptionally rich.
• In Beta, four citizens out of five earn only ₹1,00,000 — that is ₹4,00,000 below the average. The fifth citizen alone earns ₹21,00,000, which is more than four times the average.
Answer: No, they are not equally developed. Although both have a per capita income of ₹5,00,000, in Alpha the income is equally distributed so people are genuinely comfortable, while in Beta the income is highly unequal and 80% of citizens live on a fifth of the average. Most people would clearly prefer to live in Alpha.
The conclusion the examiner wants in words: Average income is useful for comparison but it hides the distribution of income. It does not reveal how that income is shared among the people.
2. It ignores non-income aspects of life. Health, education, safety, freedom and a clean environment do not appear in an income figure at all.
3. It cannot capture public facilities. Things like clean water, public health care, ration shops and safe streets are shared and free or subsidised, so they never show up as personal income even though they hugely affect how well people live.
Learn these three as a set. Almost every 3-mark and 5-mark question on “limitations of average income” is answered by expanding them.
Why this works — the mechanics of a misleading average. An average is pulled towards extreme values. One very large number in a small group drags the average far above where most of the group actually sits. Statisticians say the average is “sensitive to outliers”. In plain language: put one crorepati in a room of daily-wage workers and the room’s average income becomes meaningless. Let me show you that literally.
(a) Step 1 — total earned by the 9 workers.
₹12,000 × 9 = ₹1,08,000
Step 2 — add the owner.
₹1,08,000 + ₹4,20,000 = ₹5,28,000 (total for all 10)
Step 3 — divide by 10.
₹5,28,000 ÷ 10 = ₹52,800 per person per month
(b) Compare each person with ₹52,800. All 9 workers earn ₹12,000, which is far below ₹52,800. Only the owner is above it. So 9 out of 10 people earn less than the average.
(c) Interpretation. The average of ₹52,800 makes this workshop sound prosperous, but it describes nobody. The typical worker takes home ₹12,000 — less than a quarter of the average. A single very high income has pulled the average up and concealed the reality of the other nine. This is exactly what happens at the level of a country: a per capita income can look healthy while a large majority of citizens live well below it.
Bonus insight for stronger students: if you lined up all ten incomes and picked the middle one, you would get ₹12,000. That middle value (the median) describes this group far better than the average does. You are not required to know the word “median” for the Class 10 board exam, but understanding why the average misleads will make your written answers noticeably sharper.
Step 1 — total before.
₹15,000 × 10 = ₹1,50,000
Step 2 — total after. If the average of 11 households is ₹30,000, then
Total after = ₹30,000 × 11 = ₹3,30,000
Step 3 — the newcomer’s income is the difference.
₹3,30,000 − ₹1,50,000 = ₹1,80,000 per month
Step 4 — the real question. Has anything improved for the original ten families? No. Every one of them still earns exactly ₹15,000. Not one rupee has changed hands in their favour. Yet on paper the colony’s “per capita income” has doubled, from ₹15,000 to ₹30,000.
Answer in exam language: A rise in average income does not automatically mean that ordinary people are better off. If the increase is captured by a few, average income rises while the majority’s standard of living stands still. This is why development must be judged by distribution and by non-income indicators as well.
Verify it yourself: new total = (10 × 15,000) + 1,80,000 = 1,50,000 + 1,80,000 = ₹3,30,000, and 3,30,000 ÷ 11 = ₹30,000. ✓
Beyond Income: Health, Education And Other Criteria
If income alone cannot tell us how developed a place is, what else should we measure? The answer the chapter gives is beautifully simple: measure the things that income is supposed to buy. Instead of asking “how much money do people have?”, ask “are people living long and healthy lives, and are they educated?”
Think of it as checking the results rather than the resources. If a family spends a lot on food but the children are still undernourished, the spending figure was not the truth — the children’s health is. Countries work the same way. So economists use a small set of health and education indicators alongside income. You need to know four of them well enough to define and calculate.
IMR = (infant deaths in the year ÷ live births in the year) × 1,000
Lower is better.
2. Literacy Rate. The proportion of the population aged 7 years and above that can read and write.
Literacy rate = (number of literate persons aged 7+ ÷ total population aged 7+) × 100
Higher is better.
3. Net Attendance Ratio (NAR). The number of children of a particular age group who are actually attending school, as a percentage of the total number of children in that age group. In this chapter it is usually quoted for the 14–15 year age group (classes IX–X).
NAR = (children of that age group attending school ÷ total children of that age group) × 100
Higher is better.
4. Per Capita Income. Already covered — total income ÷ population. Higher is better.
Let me unpack each one, because the definitions have small details that examiners check.
Infant mortality rate. Why babies under one year old? Because a newborn is the most fragile member of any society. Whether a baby survives its first year depends on almost everything at once: whether the mother was nourished during pregnancy, whether a trained health worker attended the birth, whether there is clean water at home, whether a doctor or a primary health centre is within reach, whether vaccines arrived. So a single number — how many out of 1,000 babies did not survive — quietly summarises the health system of a whole region. That is why economists love it. Notice also that the denominator is live births, not total population, and that the multiplier is 1,000, not 100. Both details are commonly asked.
Literacy rate. The “7 years and above” restriction exists because children below seven are not expected to be able to read and write, so including them would unfairly drag the figure down. Remember also that literacy is a very low bar — being able to read and write is not the same as being educated or skilled. A place can have a high literacy rate and still have poor-quality schooling. That nuance is worth a mark in a well-written answer.
Net attendance ratio. This one exists because enrolment and attendance are different things. Many children are on a school register but rarely come — they are working, or minding siblings, or the school is too far. Enrolment flatters the picture; attendance tells the truth. NAR therefore measures whether children of school-going age are actually in class, which is a much better indicator of real educational development.
Step 1 — write the formula.
IMR = (infant deaths ÷ live births) × 1,000
Step 2 — substitute.
IMR = (1,250 ÷ 50,000) × 1,000
Step 3 — simplify the fraction first (easier than long division).
1,250 ÷ 50,000 = 0.025
Step 4 — multiply by 1,000.
0.025 × 1,000 = 25
Answer: The infant mortality rate is 25 per 1,000 live births.
Always state the unit. “25” alone is incomplete; “25 per 1,000 live births” is the full answer. And sanity-check the size: IMR values in the real world typically run from single digits in the best-performing regions to a few dozen in the worst. If your answer comes out as 250 or 0.25, you have slipped a decimal.
Literacy rate = (6,80,000 ÷ 8,50,000) × 100
6,80,000 ÷ 8,50,000 = 0.8
0.8 × 100 = 80%
Question (b): The same town has 2,25,000 children in the 14–15 year age group, of whom 1,71,000 are actually attending school. Find the net attendance ratio.
NAR = (1,71,000 ÷ 2,25,000) × 100
1,71,000 ÷ 2,25,000 = 0.76
0.76 × 100 = 76%
Interpretation (this is where the extra mark lives): The town’s literacy rate of 80% looks reasonable, but a net attendance ratio of 76% means that roughly one child in four aged 14–15 is not in school at the very stage when secondary education should be completed. Those children are likely to be working, or to have dropped out. So the town’s educational development is weaker than the literacy figure alone suggests — which is precisely why we use more than one indicator.
Now comes the finding that surprises students most, and that CBSE asks about almost every year: a state can have a higher per capita income than its neighbour and yet be worse off in health and education. Income and well-being do not always move together.
Look at this table carefully. Every figure in it is illustrative — I have invented three states so that you can practise the reasoning without worrying about which year the data is from.
| Indicator | State P | State Q | State R |
|---|---|---|---|
| Per capita income (₹ per year) | 2,10,000 | 1,55,000 | 78,000 |
| Infant mortality rate (per 1,000 live births) | 32 | 8 | 38 |
| Literacy rate (%) | 68 | 94 | 66 |
| Net attendance ratio, ages 14–15 (%) | 62 | 86 | 55 |
(a) State P, with ₹2,10,000 per year. It is ahead of State Q (₹1,55,000) by ₹55,000 and ahead of State R (₹78,000) by ₹1,32,000.
(b) State Q, clearly and on every count:
• Its IMR is 8, against 32 in P and 38 in R — that is, State P loses four times as many infants per 1,000 live births as State Q.
• Its literacy rate is 94%, against 68% in P and 66% in R.
• Its net attendance ratio is 86%, against 62% in P and 55% in R.
(c) The conclusion. State P earns more per person than State Q, yet its people are markedly less healthy and less educated. Therefore a higher per capita income does not guarantee better health, education or overall well-being. Income tells us what people can buy privately; it says nothing about whether the state has provided good hospitals, schools, clean water and nutrition. To judge development properly we must look at income together with health and education indicators.
How to score full marks on data questions: always quote the figures from the table. Writing “State Q is better in health” earns less than “State Q’s IMR is 8 compared with 32 in State P”. Numbers are your evidence — use them.
Why does this happen? Why can a richer state have sicker citizens? Three reasons, and they are the meat of a 5-mark answer:
- Unequal distribution. A high average income may be concentrated in a few hands, or in a few districts, while most families remain poor. The average looks good; the median household does not benefit.
- Weak public provision. Health and education depend heavily on what the government provides — primary health centres, trained nurses, immunisation drives, government schools, mid-day meals. A state may be commercially prosperous but administratively neglectful, while a less wealthy state may have invested steadily in schools and health centres for decades.
- Social factors income cannot fix. Female literacy, the age at which girls marry, awareness about nutrition and hygiene, and the status of women in the household all strongly affect infant survival. These change through education and social reform, not through income alone.
The exact numbers in that table come from a particular set of years (per capita income and IMR figures are revised in each new Economic Survey and SRS bulletin), so they go out of date. Copy the exact figures from your own edition of the textbook into your notes and use those in the exam — do not rely on a number from memory or from a coaching sheet. What never changes, and what actually earns the marks, is the reasoning: higher income, worse health, therefore income alone is an inadequate measure of development.
Public Facilities And Why Income Alone Cannot Buy Them
We have arrived at what I think is the most quietly powerful idea in the chapter. Read this section slowly — students who understand it write noticeably better answers than students who have only memorised it.
Start with a small thought experiment. Suppose your family suddenly becomes very wealthy. List the things that would improve. A bigger house, yes. Better food, yes. A car, private schooling, treatment in a good private hospital — all yes. Now list the things that would not improve, no matter how much money you had.
- The air outside your gate. You cannot buy a private atmosphere. You breathe whatever the city breathes.
- Whether the neighbourhood is free of mosquitoes and epidemics. If the drains around you are choked and dengue spreads, wealth will not build you a private immunity.
- Whether the roads are safe and traffic is orderly.
- Whether there is an epidemic-free water supply in the locality. You can buy bottled water, but the vegetable seller, the milkman and the household helper drink the local water, and disease does not respect a boundary wall.
The things a society provides to all its people together are called public facilities: schools, hospitals and primary health centres, clean drinking water, sanitation and drainage, public transport, electricity, ration shops, roads, street lighting and public safety.
Because these are shared, they are best provided collectively, mainly by the government. It is far cheaper and far fairer for a government to supply piped clean water to a whole town than for each family to buy water separately — and the poorest families could never afford to buy it at all.
Why this works — the economics behind it. There are two separate arguments here, and a top answer uses both.
- The efficiency argument. Providing something once for a whole community costs much less per person than everyone arranging it privately. One municipal water treatment plant is cheaper than a lakh of household purifiers. One good government school serves five hundred children. Collective provision spreads the cost.
- The equity argument. If a facility is left entirely to the market, only those who can pay will get it. A family living on a daily wage cannot buy private schooling, private health insurance and bottled water. So market provision automatically excludes the poor, and inequality deepens across generations — the uneducated child of an uneducated parent stays poor. Public provision breaks that cycle.
And here is the link back to per capita income: none of this shows up in an income figure. A child who attends a free government school with a good teacher is genuinely better off, but no rupee appears in her family’s income. A village that gets a functioning primary health centre has become more developed, yet its per capita income may not budge. This is the third limitation of average income we listed earlier, and now you can see exactly why it matters.
The Public Distribution System And Food Security
Let me explain one important public facility properly, in plain language, because it comes up in questions.
A family can be perfectly willing to work and still not have enough to eat — because wages are low, because prices of grain rise sharply, or because the earning member falls ill. Hunger is not always the result of laziness; very often it is the result of a bad month. Left to the open market, a poor family in a bad month simply eats less.
The Public Distribution System (PDS) is the arrangement that stands in the way of that outcome. Government agencies purchase foodgrains from farmers, store them, and then distribute them through a network of ration shops (fair price shops) to families holding ration cards, at prices well below the market price. So the family in the bad month can still buy wheat, rice and other essentials.
Notice what the PDS achieves in the language of this chapter. It raises the family’s real standard of living without raising its income by a single rupee. Their per capita income statistic is unchanged; their children eat. That is precisely the gap between “income” and “development” that this whole chapter has been circling.
Where the PDS works well — where ration shops are open regularly, stocks arrive, and the grain is of decent quality — nutrition and food security improve visibly. Where it works badly, families with valid ration cards still go without. So the existence of a scheme is not the same as the delivery of a facility, and a thoughtful answer will say so.
Model answer:
(1) Some goods are collective by nature. A pollution-free environment and disease-free surroundings cannot be purchased by an individual for himself alone. However rich a family is, it breathes the same air and lives amid the same drains as its neighbours.
(2) Collective provision is far cheaper. Supplying piped, treated water to an entire locality costs much less per household than every family arranging its own safe water. The same is true of drainage, street lighting and roads.
(3) The poor would otherwise be excluded. If schools and hospitals were available only against payment, families with very low incomes could not afford them, and their children would remain uneducated and unhealthy — passing poverty to the next generation. Public schools and primary health centres break this cycle.
(4) Public facilities directly raise the standard of living without raising income. Through the Public Distribution System, ration shops supply foodgrains at subsidised prices, so a poor family can eat adequately even when wages are low. Their income has not increased, but their real well-being has.
(5) Conclusion. Therefore income is not enough by itself. The quality of public facilities available to people — schools, health care, clean water, sanitation, food security and safety — is an essential part of development, and it is best provided collectively by the government.
Annotation: the marks are spread over five distinct ideas — collective goods, cost efficiency, equity, a named example (PDS), and a conclusion. A student who writes only “government should provide schools and hospitals” has one idea and gets one or two marks.
The Human Development Index And The Human Development Report
We now have a problem of abundance. We have per capita income, infant mortality rate, literacy rate, net attendance ratio — and a country can be strong on one and weak on another. If country X leads on income and country Y leads on health, who is “more developed”? Comparing four separate columns for a hundred and ninety countries is impossible by eye.
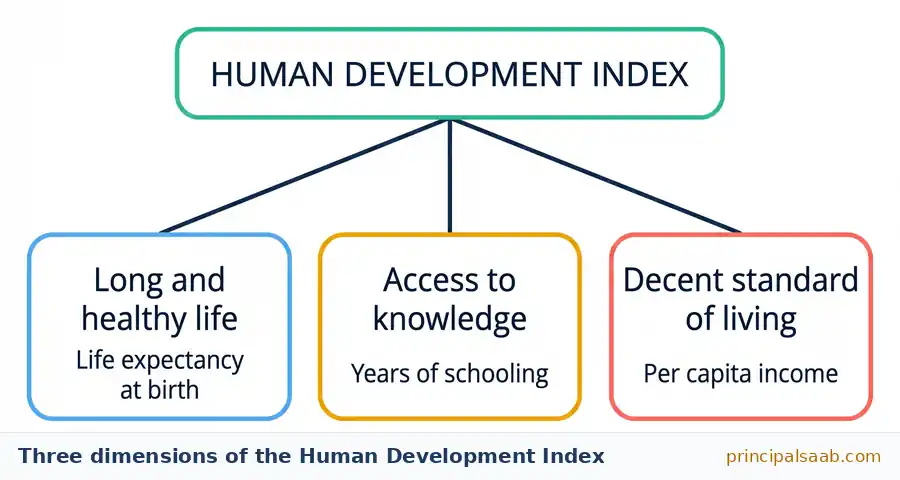
The solution is to combine the indicators into a single index. That is exactly what the Human Development Index (HDI) does.
The HDI is published in the Human Development Report, brought out by the United Nations Development Programme (UNDP). Learn those two names precisely — “HDI is published by UNDP in the Human Development Report” is a standard one-mark answer, and students lose it by writing “World Bank” instead. Remember the split like this: the World Bank sorts countries by income; the UNDP ranks them by human development.
1. A long and healthy life — captured by life expectancy at birth, the average number of years a newborn is expected to live.
2. Access to knowledge — captured by education measures such as expected years of schooling for a child entering school and mean years of schooling already completed by adults.
3. A decent standard of living — captured by per capita income, adjusted so that incomes in different countries can be compared fairly.
Memory hook: live long, learn well, live decently — health, education, income.
The HDI value lies between 0 and 1. The closer to 1, the higher the level of human development. Countries are then ranked from highest HDI to lowest.
Why this works. Notice how neatly the three dimensions answer the criticisms we made of income earlier. Income by itself ignored health — so HDI puts life expectancy in. Income ignored education — so HDI puts schooling in. And income still matters because you cannot live decently without it — so income stays, but as one of three, not as the whole story. HDI is, in effect, this chapter’s argument turned into a number.
One technical detail worth understanding even though you will not be asked to compute it: the three dimensions are first converted into indices between 0 and 1, and then combined. The UNDP combines them using a geometric mean rather than a simple average, and it does that deliberately — a geometric mean punishes imbalance. A country that is excellent at two things and terrible at the third cannot hide behind its strengths. Development, the method is saying, has to be all-round.
| Country | Per capita income (US $ per year) | Life expectancy at birth (years) | Mean years of schooling | Illustrative HDI value |
|---|---|---|---|---|
| Norvania | 62,000 | 82 | 13.0 | 0.940 |
| Petrolia | 68,000 | 71 | 7.5 | 0.812 |
| Mediterra | 21,000 | 79 | 11.0 | 0.836 |
| Savanna | 3,400 | 61 | 5.0 | 0.514 |
(a) HDI ranking, highest first: Norvania (0.940) → Mediterra (0.836) → Petrolia (0.812) → Savanna (0.514).
(b) Petrolia has the highest per capita income of all four (US $68,000, above even Norvania’s $62,000), yet it ranks only third on HDI. The reason is visible in the other two columns: its life expectancy is 71 years, eleven years below Norvania’s 82, and its mean years of schooling is only 7.5, against 13.0 in Norvania. Its wealth has not translated into health and education for its people.
Look at Mediterra too — with a per capita income roughly one-third of Petrolia’s, it still achieves a higher HDI, because its people live longer (79 years) and study longer (11.0 years).
(c) The lesson. A country’s rank on income and its rank on human development can differ sharply. High income is an opportunity, not an achievement — what matters is whether that income is converted into longer lives and better education for ordinary people, through health services, schools and other public facilities.
So do not write a sentence like “India’s HDI rank is ___”. If a question needs a current figure, look it up in the latest Human Development Report on the UNDP website, or in the current edition of your textbook, and state the report year alongside it — for example, “according to the Human Development Report of [year], India’s HDI rank was ___”. Naming the year protects you: it turns a possibly-stale claim into an accurate statement about a specific report.
What is safe to write in any year: HDI is published by the UNDP in the Human Development Report; it combines life expectancy, education and per capita income into a single value between 0 and 1; and a country’s HDI rank can be quite different from its rank on income alone.
Model answer:
(1 — definition) The Human Development Index is a composite index published by the United Nations Development Programme (UNDP) in its Human Development Report. It measures the overall development of a country by combining several aspects of human life into a single value between 0 and 1, and ranks countries on that basis.
(2 — the three dimensions) HDI is built on three dimensions: a long and healthy life (measured by life expectancy at birth), access to knowledge (measured by years of schooling), and a decent standard of living (measured by per capita income).
(3 — first advantage) It is better than per capita income because income alone ignores health and education. A country may earn well and still have short life spans and poor schooling. HDI captures those directly.
(4 — second advantage) HDI treats income as a means to a good life, not as the goal itself. It asks whether a country’s wealth has actually been converted into longer, better-educated lives for its people.
(5 — third advantage and conclusion) Because it combines three dimensions, HDI gives a fuller and more balanced picture of well-being, and it is common for a country to rank high on income yet lower on HDI, which reveals weaknesses that an income figure alone would have hidden.
Annotation: definition, dimensions, and three reasons. Also note the safe phrasing throughout — no rank numbers, no year-specific values, nothing that can go out of date.
1. Attributing HDI to the World Bank. It is the UNDP. The World Bank publishes the World Development Report and classifies countries by income; the UNDP publishes the Human Development Report and ranks them by HDI.
2. Saying HDI ignores income. It does not — per capita income is one of its three dimensions. HDI does not reject income; it refuses to stop at income.
Sustainability Of Development
One question remains, and it is the one the chapter saves for last: can the development we have achieved actually continue?
Everything we have discussed so far — rising incomes, more schools, better health care, more factories, more electricity — rests on the natural world. Crops need soil and water. Factories need coal, oil, iron ore and water. Cities need groundwater and land. Every improvement in living standards has been drawing on a natural bank account. And a bank account can be emptied.
The core insight: it is not enough for development to be large. It must also be able to last. Growth that exhausts the resources it depends on is borrowing from our children and calling it progress.
To see why this is urgent, it helps to divide natural resources into two kinds.
| Renewable resources | Non-renewable resources |
|---|---|
| Can be replenished by natural processes within a human timescale — groundwater, forests, fish stocks, soil fertility, solar and wind energy. | Have a fixed stock on earth and cannot be replenished once used — crude oil, natural gas, coal, and most minerals. |
| The danger: they are renewable only if we use them no faster than they regenerate. Draw water out faster than the rain puts it back and even a renewable resource is destroyed. | The danger: every unit used is gone permanently. The only questions are how long the stock lasts and what we replace it with. |
Case One: Groundwater — A Renewable Resource Being Used Unsustainably
Groundwater is the water stored in the layers of rock and soil beneath our feet. It is renewable: rain seeps down through the soil and slowly recharges these underground stores. This is the water that tube wells and hand pumps draw up, and it irrigates a very large share of India’s farmland and supplies drinking water to a great many towns and villages.
So how can a renewable resource be in crisis? Because renewable does not mean unlimited — it means it refills at a certain rate. Picture a tank that is filled by a thin pipe. If you draw water out with a thin straw, the tank stays full forever. If you attach a powerful pump and draw far faster than the pipe refills, the tank empties no matter how “renewable” the supply is.
That is what has happened in many parts of India. Over recent decades, the spread of electric and diesel pumps allowed farmers and towns to extract groundwater at a rate far beyond what the monsoon replenishes. The consequences are well documented and easy to observe:
- Falling water tables. Wells and hand pumps that once yielded water at shallow depth have to be drilled deeper and deeper, which costs more each time.
- Wells and tube wells running dry, especially in the summer months, leaving villages dependent on tankers.
- Rising costs and debt for farmers who must repeatedly deepen borewells, sometimes borrowing to do so.
- Deterioration in water quality in some areas as deeper layers are tapped and as coastal aquifers draw in saline water.
- Sharp inequality, since a family that cannot afford a deep borewell simply loses access to water while a wealthier neighbour keeps pumping.
Notice how this connects to everything earlier in the chapter. Groundwater over-use is a case where this generation’s higher agricultural income is being purchased with the next generation’s water. Per capita income today goes up; the resource base underneath it goes down. That is unsustainable development in one sentence.
What can be done? Rainwater harvesting so that rain is directed back into the ground instead of running off; drip and sprinkler irrigation which deliver water to the root rather than flooding the field; growing crops that suit the local rainfall instead of water-hungry crops in dry regions; recharging wells and reviving village ponds and tanks; and regulating how much water can be extracted. None of these is dramatic. Sustainability rarely is — it is mostly the discipline of taking less than you are given.
Case Two: Crude Oil — A Non-Renewable Resource With A Fixed Stock
Crude oil is the opposite kind of case. It formed over many millions of years from buried organic matter, and it is not being formed again at any rate that matters to us. The earth’s stock is fixed and finite. Every barrel burnt is a barrel that will never exist again.
Modern life leans on this one resource astonishingly heavily: petrol and diesel for transport, aviation fuel, fertilisers, plastics, paints, synthetic fabrics, and countless chemicals. Two features of the world oil situation matter for your answer:
- The reserves are limited and will eventually be exhausted. Estimates of exactly how many years of oil remain are revised constantly as new fields are found, as extraction technology improves and as consumption changes — so avoid quoting a specific number of years. The direction is what matters: the stock is finite and we are drawing it down.
- The reserves are very unevenly distributed. A large share of the world’s known crude oil lies in a small number of countries, particularly in West Asia. Countries like India, which consume far more oil than they produce, must import most of their requirement. That makes their economy vulnerable to price shocks and to political disturbance far away.
There is a second cost too, beyond exhaustion. Burning fossil fuels releases carbon dioxide and other gases that contribute to global warming and climate change, along with local air pollution that damages health directly. So oil imposes a bill twice: once when we run out, and continuously while we use it.
What can be done? Shift towards renewable energy — solar, wind, hydro and biomass; improve energy efficiency so that less fuel does the same work; expand public transport, railways and electric vehicles; and recycle plastics and metals so that less virgin material is needed. Again, the logic is simple: replace what runs out with what does not.
Model answer:
(1 — definition) Sustainable development means development that fulfils the needs of the present generation without compromising the ability of future generations to meet their own needs. It insists that the level of development we achieve must be capable of continuing over time.
(2 — the underlying reason) All economic activity depends on natural resources — land, water, minerals and fuels. If these are consumed faster than they can be replaced, growth today makes growth tomorrow impossible. Development must therefore respect the limits of the resource base.
(3 — example one: groundwater, a renewable resource being overused) Groundwater is renewable, since rain recharges it, but in large parts of India it is being extracted far faster than it is replenished. Water tables have fallen, wells and tube wells run dry, borewells must be dug ever deeper at rising cost, and poorer farmers who cannot afford deep borewells lose access to water altogether. Present agricultural gains are thus being made at the cost of future water security.
(4 — example two: crude oil, a non-renewable resource) Crude oil has a fixed stock on earth and cannot be replaced once used, yet transport, fertilisers and plastics all depend on it. Its reserves are also concentrated in a few countries, so importing nations face price and supply uncertainty. Burning it further causes air pollution and contributes to global warming.
(5 — conclusion and the way forward) Hence development must be sustainable. This requires conserving water through rainwater harvesting and efficient irrigation, shifting to renewable sources of energy such as solar and wind, improving energy efficiency, recycling materials, and protecting forests — so that the coming generations inherit a resource base as good as the one we received.
Annotation: definition, reasoning, two well-developed examples with consequences, and a forward-looking conclusion. Note that no specific “years of oil left” figure is quoted — never invent one.
How To Answer Development Questions In The Board Exam
You now know the content. This section is about not throwing marks away. I have seen students who understand this chapter perfectly score four out of five simply because they wrote a paragraph instead of points, or forgot to give an example. Let us fix that.
The Point → Explain → Example Structure
Almost every theory answer in this chapter should be built from the same three-part unit, repeated as many times as there are marks:
- Point — a short, bold, direct statement of the idea. (“Average income hides the distribution of income.”)
- Explain — one or two sentences saying why. (“Two countries can have the same average while in one the income is shared evenly and in the other it is concentrated in a few hands.”)
- Example — a concrete illustration. (“If four people earn ₹1,00,000 each and a fifth earns ₹21,00,000, the average of ₹5,00,000 describes none of them.”)
One such unit is roughly one mark. So a 3-mark question needs three units; a 5-mark question needs five, or four plus a conclusion. This is the single most useful habit you can build for the Economics section.
| Question type | What to write | Rough length |
|---|---|---|
| 1 mark (MCQ / very short) | The exact term or the one-line definition. No explanation needed. If it asks for a formula, write the formula. | One line |
| 3 marks | Three separate points, each with a short explanation. Number them or start each on a new line. An example in at least one of them. | 60–80 words |
| 5 marks | Five points (or four points plus a one-line conclusion), each with explanation, at least two with examples. | 100–130 words |
| 4-mark case study / source-based | Read the passage or table twice, then answer each sub-part separately, quoting figures or phrases from the source as evidence. | 2–3 lines per sub-part |
| Numerical | Formula → substitution → calculation → answer with unit. Never write only the final number. | Four short lines |
Handling Case-Study And Data-Interpretation Questions
The Economics section of the paper reliably contains a case study or a data table, and this chapter is a favourite source for them. Here is a method that works every time:
- Read the sub-questions first, then the source. You will read the passage or table far more purposefully once you know what you are hunting for.
- Underline the numbers or key phrases in the source with a pencil as you read. In a table, note which indicators are “higher is better” (income, literacy, attendance) and which are “lower is better” (infant mortality).
- Do any arithmetic on the side first, then write the clean version into the answer. Do not calculate in the middle of a sentence.
- Quote your evidence. “State Q’s IMR is 8 against State P’s 32” beats “State Q is healthier”. The figure is the mark.
- Answer the actual question asked. If it says “which state” — name the state. If it says “why” — give a reason. Do not decorate; the marks are for precision.
- Finish with the general principle if the last sub-part invites it, e.g. “hence per capita income alone is not a sufficient measure of development.”
1. Why is average income used to compare countries, and what are its limitations?
2. Why is income alone not an adequate measure of development? (public facilities, health, education)
3. What is sustainable development and why is it necessary? (groundwater, crude oil)
Write out one full answer to each in your own handwriting, time yourself, and keep them for revision.
2. Giving the final number in a numerical without showing the formula and substitution.
3. Omitting units — ₹, %, “per 1,000 live births”, “per year”.
4. Quoting a specific HDI rank or World Bank threshold from memory, which may well be out of date. State the report and year, or avoid the number.
5. Answering “development means growth of industries” — the chapter’s whole argument is that development is about people’s lives, not only about output.
Practice Worksheet With Answers
Here are ten original questions, mixed exactly the way a board paper mixes them: three 1-mark objective questions, three 3-markers, two 5-markers, and two 4-mark case-study/data-interpretation questions. Every numerical answer here has been worked out and checked.
How to use this properly. Close your notes. Take a sheet of paper and actually write the answers out by hand — thinking an answer and writing an answer are different skills, and only one of them is tested in March. Give yourself about 40 minutes for all ten. Only after you have finished should you open the “Show Answer” panels. Marking your own script honestly is where the real learning happens.
(a) total income of the country by the number of families
(b) total income of the country by its total population
(c) total income of the country by the number of working people
(d) total savings of the country by its total population
Show Answer
Per capita income, also called average income, = total income ÷ total population. Option (a) is the classic trap — it says families, not population. Option (c) is wrong because non-earning members (children, the elderly, the unemployed) are part of the population and must be counted in the denominator. Option (d) is wrong because we divide income, not savings.
(a) ₹8,000 (b) ₹80,000 (c) ₹8,00,000 (d) ₹64,80,000
Show Answer
Working:
Per capita income = Total income ÷ Population
= 7,20,000 crore ÷ 9 crore
= ₹80,000 per year
Check backwards: ₹80,000 × 9 crore = 7,20,000 crore ✓
Option (d) is what you get if you multiply instead of dividing — a genuinely common slip under time pressure. Options (a) and (c) are decimal-place errors. Whenever your answer to a per-capita question looks enormous, you have almost certainly multiplied.
(a) the World Bank
(b) the World Trade Organisation
(c) the United Nations Development Programme (UNDP)
(d) the Reserve Bank of India
Show Answer
Keep the two big publications separate in your mind:
• The World Bank publishes the World Development Report and classifies countries into income groups using per capita income.
• The UNDP publishes the Human Development Report, which contains the Human Development Index combining health, education and income.
Mixing these two up is one of the most frequently repeated errors in the Economics section.
Show Answer
1. Different situations produce different goals. People want what is missing from their own lives. A farmer who depends entirely on the monsoon wants irrigation from a canal or tube well, while a girl in a restrictive household wants the freedom to study and choose her own career. Neither goal is wrong; they simply arise from different circumstances.
2. Some goals are directly conflicting — wages. A landless labourer’s goal is a higher daily wage, while a large farmer’s goal is to obtain labour cheaply at harvest time so his costs stay low. If one gets what he wants, the other loses. Both cannot be fully satisfied.
3. Some goals are conflicting — large projects. A big dam or an industrial plant brings electricity, irrigation and employment to one region, but the families whose land is submerged or acquired lose their homes and livelihoods. The same project is development for one group and displacement for another.
Marking note: Point 1 establishes “different”; points 2 and 3 establish “conflicting”. A script that gives three examples of merely different goals has answered only half the question and typically scores 2 out of 3.
Show Answer
Countries have very different populations, so total income does not tell us how well off an individual is. A country with a large total income may have to share it among a very large population, leaving each person poorly off. Dividing total income by population gives us income per person, which allows a fair comparison between countries of different sizes. This is why the World Bank uses per capita income for its classification.
Limitation 1 (1 mark) — it hides the distribution of income. Two countries can have the same average income while in one it is shared fairly evenly and in the other most of it is held by a few. For instance, if four citizens earn ₹1,00,000 each and a fifth earns ₹21,00,000, the average of ₹5,00,000 describes none of them — four out of five live far below it.
Limitation 2 (1 mark) — it ignores non-income aspects of well-being. Health, education, safety, equal treatment, freedom and a clean environment are central to a good life but do not appear in an income figure. Public facilities such as government schools, primary health centres and ration shops improve people’s lives without raising their income at all.
Marking note: the word distribution should appear explicitly. A numerical illustration in the first limitation is worth including — it converts a vague claim into proof.
(a) Calculate the infant mortality rate.
(b) Calculate the literacy rate.
(c) What do these two figures together tell you about the district?
Show Answer
Formula: IMR = (infant deaths ÷ live births) × 1,000
= (588 ÷ 42,000) × 1,000
588 ÷ 42,000 = 0.014
0.014 × 1,000 = 14 per 1,000 live births
(b) Literacy rate (1 mark)
Formula: Literacy rate = (literate persons aged 7+ ÷ total persons aged 7+) × 100
= (4,32,000 ÷ 5,40,000) × 100
4,32,000 ÷ 5,40,000 = 0.8
0.8 × 100 = 80%
(c) Interpretation (1 mark)
An IMR of 14 is relatively low, which suggests reasonably good maternal and child health services — safe deliveries, immunisation and access to health centres. A literacy rate of 80% means, however, that one person in five aged seven and above still cannot read and write. So the district has done better on health than on education, and educational development still needs attention. Both indicators must be read together, because a place can perform well on one and poorly on the other.
Check your working: 14 × 42 = 588 ✓ (since 42,000 live births make 42 groups of 1,000). And 80% of 5,40,000 = 4,32,000 ✓.
Show Answer
1. Some goods cannot be bought individually at all. A pollution-free environment and disease-free surroundings cannot be purchased by one household for itself. However wealthy a family is, it breathes the same air as the rest of the city and lives amid the same drains and mosquitoes. These are collective goods.
2. Collective provision is much cheaper. It costs far less to supply treated piped water, drainage, street lighting and roads to a whole locality than for every family to arrange these privately. The cost is shared, so each household pays a fraction of what it would pay alone.
3. Without public facilities the poor are excluded. If schools and hospitals were available only against payment, families on low or irregular incomes could not afford them. Their children would remain uneducated and unhealthy, and poverty would pass to the next generation. Government schools and primary health centres break this cycle.
4. Public facilities raise the standard of living without raising income. Under the Public Distribution System, ration shops supply foodgrains at subsidised prices to families holding ration cards. Such a family’s income is unchanged, yet it can now eat adequately even when wages are low or prices rise. This is real development that never appears in an income statistic.
5. Conclusion. Therefore the availability and quality of public facilities — schools, health care, clean drinking water, sanitation, food security, transport and public safety — is an essential measure of a country’s development, alongside income. Income tells us what people can buy privately; public facilities determine the quality of the shared life around them.
Marking note: the phrase “pollution-free environment and disease-free surroundings” (or your own clear equivalent) plus one named facility (PDS, primary health centre, government school) is what separates a full-mark answer from a general one.
Show Answer
Renewable resource — groundwater (1 mark). Groundwater is renewable because rain seeps into the ground and recharges it. But in many parts of India it is being extracted much faster than it is replenished, mainly for irrigation. As a result, water tables have fallen, wells and tube wells run dry in summer, borewells have to be dug ever deeper at rising cost, and poorer farmers who cannot afford deep borewells lose access to water altogether. Today’s higher farm incomes are thus being bought with tomorrow’s water.
Non-renewable resource — crude oil (1 mark). Crude oil has a fixed stock on earth and cannot be replaced once it is used, yet transport, fertilisers and plastics all depend on it. Its reserves are also concentrated in a few countries, so importing nations face uncertainty of price and supply. Burning it additionally causes air pollution and contributes to global warming.
Measure 1 (1 mark) — conserve water. Promote rainwater harvesting so that rain is returned to the ground, adopt drip and sprinkler irrigation which deliver water directly to the roots, revive village ponds and tanks, and choose crops suited to the local rainfall instead of water-intensive crops in dry regions.
Measure 2 (1 mark) — shift to renewable energy and use resources efficiently. Expand solar, wind and hydro power, improve energy efficiency, strengthen public transport and railways, and recycle plastics and metals so that less virgin material is required.
Marking note: do not quote a specific number of “years of oil remaining” — such estimates are revised constantly and an invented figure will not help you. The finiteness of the stock is the point, not the countdown.
Two neighbouring countries publish their figures for the same year. Rohtia has a total annual income of ₹8,40,000 crore and a population of 6 crore. Sundara has a total annual income of ₹3,00,000 crore and a population of 2.5 crore. Rohtia’s infant mortality rate is 34 per 1,000 live births and its literacy rate is 69%. Sundara’s infant mortality rate is 11 per 1,000 live births and its literacy rate is 91%.
(a) Calculate the per capita income of each country. (2)
(b) On the basis of per capita income alone, which country appears more developed? (1)
(c) Do the other indicators support that conclusion? What does this tell you? (1)
Show Answer
Rohtia:
Per capita income = Total income ÷ Population
= 8,40,000 crore ÷ 6 crore
= ₹1,40,000 per year
(Check: 1,40,000 × 6 = 8,40,000 ✓)
Sundara:
Per capita income = 3,00,000 crore ÷ 2.5 crore
= ₹1,20,000 per year
(Check: 1,20,000 × 2.5 = 3,00,000 ✓)
(b) On per capita income alone (1 mark)
Rohtia appears more developed. Its per capita income of ₹1,40,000 is ₹20,000 higher than Sundara’s ₹1,20,000. Note also that Rohtia’s total income is nearly three times Sundara’s, but that is not the relevant comparison, because Rohtia’s population is also far larger.
(c) Do the other indicators agree? (1 mark)
No — they point the other way. Sundara’s infant mortality rate is 11 against Rohtia’s 34, meaning roughly three times as many infants die per 1,000 live births in Rohtia. Sundara’s literacy rate is 91% against Rohtia’s 69%. So the people of Sundara live healthier and better-educated lives despite earning less on average.
Conclusion: a higher per capita income does not automatically mean a higher level of development. Income measures what people can buy privately; it does not reveal how the income is distributed, nor the quality of health care, schooling and other public facilities available to them. Development must therefore be judged on income together with health and education indicators.
| Household | A | B | C | D | E | F | G | H |
|---|---|---|---|---|---|---|---|---|
| Income (₹/month) | 10,000 | 10,000 | 10,000 | 10,000 | 10,000 | 10,000 | 10,000 | 3,10,000 |
(b) How many households earn less than this average? (1)
(c) A newspaper reports that “the settlement’s average income is comfortable”. Is this a fair description? Give reasons. (2)
Show Answer
Total income = (₹10,000 × 7) + ₹3,10,000
= ₹70,000 + ₹3,10,000 = ₹3,80,000
Average = ₹3,80,000 ÷ 8 = ₹47,500 per household per month
(Check: ₹47,500 × 8 = ₹3,80,000 ✓)
(b) Households below the average (1 mark)
Seven households (A to G) earn ₹10,000 each, which is far below ₹47,500. Only household H is above it. So 7 out of 8 households — that is, 87.5% of them — earn less than the average.
(c) Is the description fair? (2 marks)
No, it is a misleading description.
Reason 1 — the average is distorted by one extreme value. Household H alone earns ₹3,10,000, which is thirty-one times what each of the other seven earns. That single very large income pulls the average up to ₹47,500, a figure that describes no household in the settlement. The typical household actually lives on ₹10,000 a month, less than a quarter of the “average”.
Reason 2 — the average conceals the distribution. An average tells us the total income shared out equally on paper, but it says nothing about how unequally that income is actually held. Here, income is extremely concentrated. To describe the settlement honestly, the newspaper should have reported the distribution of income as well, and ideally also indicators such as the health and schooling of the children living there.
General principle: average income is a useful summary for comparing places, but it is not sufficient on its own, because it hides inequality and ignores non-income aspects of well-being.
One Last Word — The Kaizen Way
If you have read this far, take a moment and notice what you have actually done. You started with a word — “development” — that seemed too vague to examine, and you now know how to define it from six different points of view, how to calculate per capita income and infant mortality rate, why an average can lie to you, what the UNDP measures that the World Bank does not, and why a tube well and a barrel of oil belong in the same conversation. That is not a small afternoon’s work.
There is a Japanese idea called kaizen — improvement so small that it feels almost too easy, repeated so often that it becomes enormous. It is the opposite of the night-before panic that most students know too well. It says: do not try to become brilliant today. Just get one more question right than you got right yesterday.
Apply it to this chapter tomorrow. Attempt one worked example without peeking. The day after, do two. By the end of the week, write out one full 5-mark answer and time yourself. None of those days will feel like a breakthrough. But a student who adds one correct answer a day for a month walks into the exam hall thirty answers stronger than the one who waited for motivation to arrive.
And if a section still feels foggy, that is not a verdict on you — it is simply information about where to spend tomorrow’s twenty minutes. Come back to it. Read it once more, slowly, with a pencil. It will make more sense the second time. It nearly always does.