

Take a breath. If the word “economy” makes your stomach tighten a little, you are in extremely good company — most students meet this chapter and immediately assume it is going to be a swamp of percentages, graphs and words like “gross domestic product”. It is not. This chapter is actually one of the friendliest things in the whole Class 10 Social Science course, because every single idea in it is something you have already seen with your own eyes. You just have not been given the names yet.
Think about the last meal you ate. Somebody grew the grain or the vegetables. Somebody else cleaned it, ground it, packed it or turned it into something else. Somebody transported it, somebody sold it in a shop, and possibly somebody cooked it and served it to you. Four different kinds of work, four different kinds of people, all sitting quietly inside one plate of food. That is the entire chapter. Everything else — the definitions, the graphs, the exam questions — is only a tidy way of describing what is already happening around you every day.
So here is my promise to you as your tutor for the next couple of hours. We will not rush. We will build every idea from absolute zero, in ordinary language, with examples from streets and farms and shops you can picture. Where there is a calculation, I will do it in front of you, step by step, showing every single line, and I will never skip a step because “it is obvious”. Nothing here is obvious the first time. If a paragraph feels blurry, read it twice — that is not weakness, that is exactly how learning is supposed to feel.
A quick word on where this sits in your syllabus, so you know it is worth your time: “Sectors of the Indian Economy” is Chapter 2 of Understanding Economic Development, the Economics book, and it is fully part of the CBSE Class X Social Science curriculum 2026-27. The curriculum allots it 12 periods, and the Economics unit as a whole carries 20 marks in the board paper. In plain terms: this chapter alone can comfortably be worth several marks every year, and it is one of the most predictable, most scoring parts of the paper — because the questions repeat in shape, even when they change in wording.
One more reassurance before we start. This chapter has a reputation for being “part maths”. It really is not. There are exactly three kinds of arithmetic in it: adding up values, finding a percentage share, and subtracting one number from another to find a gap. You already know how to do all three. What is new is only knowing which numbers to add and why. We will make that comfortable together.
What You’ll Learn
Jump straight to any section — every link below lands on the exact heading.
- Sectors of Economic Activities: Primary, Secondary and Tertiary
- How the Three Sectors Are Interdependent
- Final Goods, Intermediate Goods and How GDP Is Measured
- The Historical Change in Sectors
- Rising Importance of the Tertiary Sector in India
- Where Are Most of the People Employed?
- Underemployment and Disguised Unemployment
- How to Create More Employment
- MGNREGA and the Right to Work
- Division of Sectors as Organised and Unorganised
- How to Protect Workers in the Unorganised Sector
- Sectors in Terms of Ownership: Public and Private
- How to Answer Sectors Questions in the Board Exam
- Practice Worksheet with Answers
- One Last Thing Before You Go
Your Game Plan
Please do not try to swallow this chapter in one sitting. It is long on purpose, because I would rather over-explain than leave you guessing. Here is the order I would use if I were sitting next to you:
- Day 1 — get the three sectors into your bones. Read the first two sections. Then close the page and classify ten activities you saw today into primary, secondary or tertiary. Ten. Out loud. This single habit is worth more than an hour of rereading.
- Day 2 — the money side. Work through final goods, intermediate goods and GDP. Do every worked example with a pen. Do not read the solution first; try, fail, then read. Failing first is how the method sticks.
- Day 3 — the employment story. Historical change, the rise of the tertiary sector, where people actually work, and underemployment. This is where most 5-mark questions live, so slow down here.
- Day 4 — the three “divisions”. Organised versus unorganised, public versus private, and how to protect vulnerable workers. Make yourself a two-column table from memory before you look at mine.
- Day 5 — exam technique and the worksheet. Read the board-answer section, then attempt all ten worksheet questions with the answers hidden. Only then open the reveals.
- Day 6 — repair work. Go back only to the sections where you got something wrong. Nothing else. Revision means fixing holes, not re-reading what you already know.
Sectors of Economic Activities: Primary, Secondary and Tertiary
Let us start with the most basic question of all, and let us answer it properly instead of jumping to definitions. Why do economists chop the economy into “sectors” at all? Why not just say “people do work” and leave it there?
Here is the honest reason. An economy is enormous and messy. In India alone, hundreds of millions of people are doing hundreds of millions of different things right now — someone is milking a buffalo, someone is welding a gate, someone is teaching a class, someone is driving a truck, someone is coding an app. If you tried to study all of that at once, you would drown. So we group similar kinds of work together, the same way you group your school subjects into “science subjects” and “language subjects”. The grouping is a thinking tool. It lets us ask useful questions like “is the farming side of our economy growing or shrinking?” without having to look at every farmer individually.
Now, there are many possible ways to group work. The one this chapter uses is beautifully simple: group activities by how close they are to nature. Some work takes things directly from nature. Some work takes what nature gave and changes its form. Some work does not make a physical thing at all — it helps the first two happen. Three steps away from nature, three sectors. That is the whole logic.
The Primary Sector: Taking Directly From Nature
The primary sector covers every activity in which we obtain a good directly by exploiting a natural resource. The key word there is directly. Nobody manufactured the wheat grain. The farmer prepared the soil, sowed the seed, watered it — but the actual creation of the grain was done by the plant, the sunlight, the rain and the earth. The farmer’s job was to help nature along and then collect what nature produced.
The same logic runs through every primary activity. A fisherman does not manufacture fish; he goes to where the fish already are and brings them out of the water. A miner does not manufacture iron ore; the ore has been sitting inside the rock for millions of years and he digs it out. A dairy farmer does not manufacture milk; the buffalo makes it. In every case the human being is the collector and caretaker, and nature is the producer.
Because so much of this sector in India is farming, the primary sector is very commonly called the agricultural sector, or “agriculture and related activities”. Do not let that confuse you: agriculture is the biggest piece of the primary sector, not the whole of it. Mining, forestry, fishing and animal rearing all sit in there too.
Some primary activities you can picture right now: growing paddy in a flooded field; picking cotton bolls by hand; tapping rubber from a tree; keeping bees for honey; catching prawns in a backwater; cutting bamboo in a forest; quarrying granite from a hillside; pumping groundwater for a crop; rearing poultry for eggs; collecting tendu leaves; extracting salt from seawater in a coastal pan; digging out coal.
The Secondary Sector: Changing the Form of What Nature Gave
The secondary sector takes the raw material that the primary sector pulled out of nature and changes its form into something more useful. Notice the phrase again — changes its form. That is the test. Nothing new is being taken out of the earth here; something already taken out is being reshaped.
Cotton by itself is a soft white fluff. It cannot keep you warm and you cannot wear it. Spin that fluff into yarn, weave the yarn into cloth, stitch the cloth into a shirt, and suddenly you have something a person will pay real money for. The cotton atoms have not changed. The form has, and the usefulness has multiplied. That, in one sentence, is what the secondary sector does for a living.
Because this transformation usually happens in a workshop, a mill or a factory, this sector is very commonly called the industrial sector or the manufacturing sector. But be careful — “factory” is not part of the definition. A woman rolling papads at home, a potter shaping clay on a wheel, a blacksmith beating a plough share into shape: all of them are changing the form of a natural material, so all of them belong to the secondary sector even though there is no factory anywhere in sight.
Secondary activities to hold in your head: turning sugarcane into sugar or jaggery; turning iron ore into steel; turning clay into bricks and roof tiles; turning milk into paneer, ghee or ice cream; turning timber into furniture; turning bauxite into aluminium sheets; turning crude oil into petrol and plastic; turning leather into shoes; building a house from cement and bricks; assembling a bicycle from steel tubes and rubber.
The Tertiary Sector: Work That Produces No Thing At All
Now the sector students find slippery, because here nothing you can hold in your hand comes out at the end. The tertiary sector consists of activities that help in the development of the primary and secondary sectors. These activities do not produce a good; they produce a service. That is why the tertiary sector is also called the service sector.
Let me make this concrete, because “service” is an abstract word. Suppose a farmer in a village has grown a magnificent crop of onions. Wonderful — except the people who want to buy onions live in a city 200 kilometres away. The onions are useless where they are. So a truck driver moves them. A wholesaler stores them until they are needed. A trader finds buyers. A bank lends the trader money to pay the farmer today rather than next month. A telephone call connects the two ends of the deal. Not one of those people grew a single onion. And yet without them, the farmer’s onions rot in the field and nobody eats.
That is the honest meaning of “service”. It is the invisible scaffolding that lets goods actually reach people. Transport, storage, communication, banking and trade are the classic examples, and it is worth noticing that all five of them exist purely to move things, keep things, tell things or fund things.
But the tertiary sector is broader than that. It also includes services people buy for themselves rather than to support production — a teacher teaching, a doctor treating, a lawyer arguing, a barber cutting hair, a cook in a restaurant, a domestic worker cleaning a home, an administrator running an office. And in modern times it includes an enormous new family of work built on information: software developers, data-entry operators, call-centre staff, accountants, designers, and everyone whose job is to handle knowledge rather than material.
The Three Sectors Side by Side
| Point of comparison | Primary Sector | Secondary Sector | Tertiary Sector |
|---|---|---|---|
| What it does | Obtains goods directly from natural resources | Changes the form of natural products into other goods | Provides services that support the other two sectors and people |
| Output | A natural good (grain, fish, ore, milk) | A manufactured good (cloth, sugar, steel, brick) | A service — nothing physical is produced |
| Other names | Agricultural sector; agriculture and related activities | Industrial sector; manufacturing sector | Service sector |
| Dependence on nature | Very high — rainfall, soil, season decide the output | Indirect — depends on raw material supplied by the primary sector | Lowest — depends mainly on demand from people and businesses |
| Everyday examples | Growing paddy, catching fish, mining coal, rearing goats | Weaving cloth, making jaggery, baking bricks, building a house | Transport, banking, teaching, nursing, software, retail selling |
Read that table across, not down. The story it tells is a journey: nature hands us something, industry reshapes it, services carry it to whoever needs it. Once you see it as a journey rather than three separate boxes, you will never mix them up again.
Question (2 marks): Classify each of the following into the primary, secondary or tertiary sector: (a) a beekeeper collecting honey, (b) a woman making pickle at home to sell, (c) an auto-rickshaw driver, (d) a worker in a cement plant, (e) a nurse in a district hospital.
How to think it through — one at a time.
(a) The honey is made by bees. The beekeeper only manages the hive and collects. Nothing is being reshaped, and it comes straight out of nature. Primary.
(b) Raw mangoes and oil and spices go in; pickle comes out. The form of the raw material has changed. It does not matter that this is a kitchen and not a factory. Secondary.
(c) He produces no good whatsoever. He moves people from place to place — a transport service. Tertiary.
(d) Limestone is dug out (that part was primary) and then burnt and ground into cement. The plant worker is changing the form of a natural material. Secondary.
(e) She heals people. No good is produced; a service is. Tertiary.
Why this works: in every single case I asked the identical question — is something being taken out of nature, is a form being changed, or is neither? You never need to memorise a list if you own that one question.
Question (3 marks): Classify with reasons: (a) a fisherman drying and salting his catch before selling it, (b) a courier delivering a parcel of medicines, (c) a construction labourer building a bridge.
Model answer.
(a) This is two activities wearing one uniform. Catching the fish is primary — the fish came straight out of the water. Drying and salting it so it keeps for months changes the form and preserves it, so that step is secondary. If an exam gives you only one blank, answer for the action the question emphasises, and mention the other in one clause. Examiners reward that awareness.
(b) The courier neither grows the medicine nor manufactures it. She moves it. Transport is a classic support service. Tertiary.
(c) Cement, steel and stone are being assembled into a structure that did not exist before — a clear change of form. Construction sits in the secondary sector.
Why this works: the exam loves activities that sit on a boundary, because that is where it can see whether you understood the rule or just memorised a list. Naming the rule in your answer — “because the form of the raw material is changed” — is often worth the mark by itself.
Question (3 marks): A village has 400 working people. 60% work in the primary sector, 15% in the secondary sector and the rest in the tertiary sector. Find the number of workers in each sector and check your total.
Step 1 — primary. 60% of 400 = (60 ÷ 100) × 400 = 0.60 × 400 = 240 workers.
Step 2 — secondary. 15% of 400 = 0.15 × 400 = 60 workers.
Step 3 — tertiary. “The rest” means 100% − 60% − 15% = 25%. So 0.25 × 400 = 100 workers.
Step 4 — the check you must never skip. 240 + 60 + 100 = 400. It matches the total we were given, so no arithmetic slip has crept in.
Why this works: “the rest” is the examiner’s favourite little trap. Students calculate 60% and 15%, then guess the third figure. Always convert “the rest” into a percentage first (100 minus the others), then apply it. And always add your three answers back to the total — it costs five seconds and catches almost every mistake.
Before you move on, do this for me. Look up from the screen and name five things you can see. For each one, say out loud which sector produced it and which sector brought it to you. The plastic bottle: secondary made it, primary gave the crude oil, tertiary trucked it to the shop. Do that five times and the three sectors stop being vocabulary and start being how you see the world. Don’t move on until this feels comfortable.
How the Three Sectors Are Interdependent
We split the economy into three sectors so that we could study it. But now I need to un-split it for you, because the single most important truth about the three sectors is this: they are not three separate economies. They are three stages of one continuous process. Remove any one of them and the other two collapse.
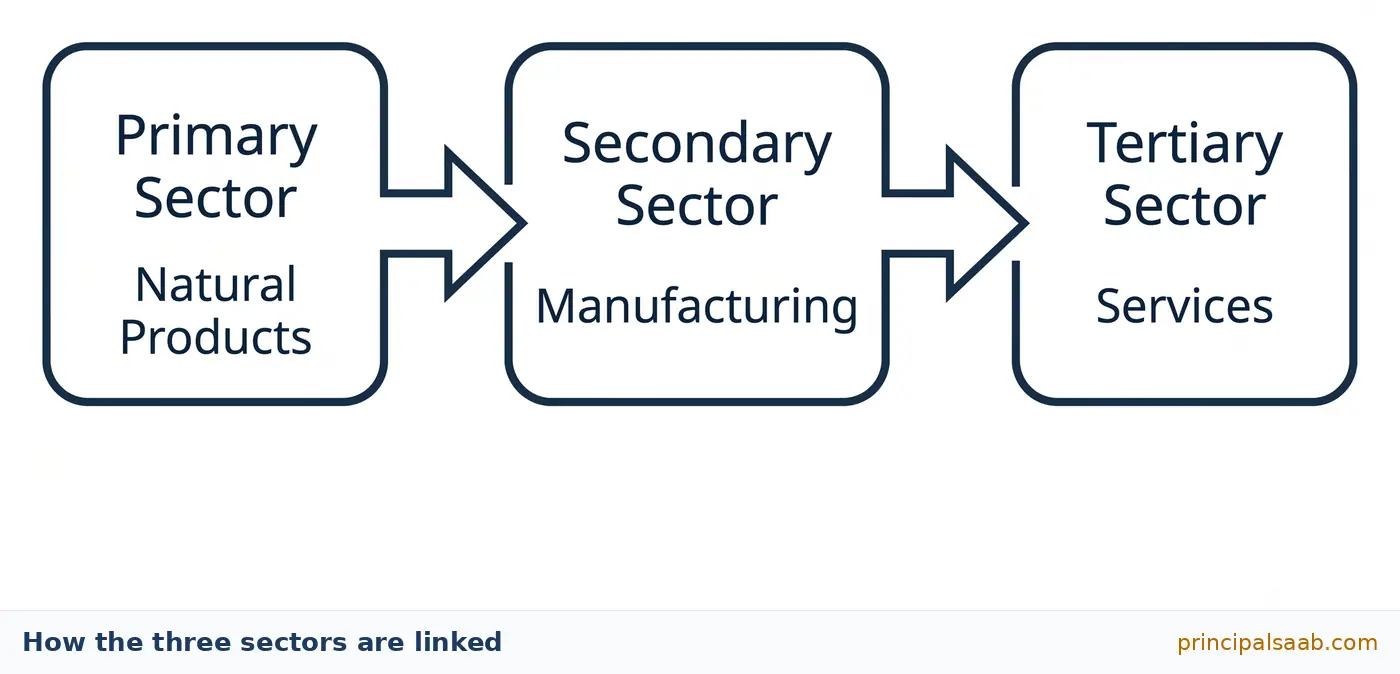
Let me walk you through a chain slowly, because this is the kind of thing an examiner can ask you to trace in a 5-mark answer, and students who have actually pictured it write far better answers than students who have only memorised the word “interdependent”.
One Glass of Milk, Six Kinds of Work
Imagine a family in a village that keeps four buffaloes.
- Primary — the fodder. Before there is any milk, there must be something for the buffaloes to eat. Somebody grows green fodder and stores dry straw. Growing is a primary activity.
- Primary — the milk itself. The buffaloes convert that fodder into milk. Rearing animals for milk is a primary activity, because the milk is obtained directly from a natural process.
- Tertiary — collection and transport. Twenty litres of milk sitting in a village helps nobody in a city. A collection van, a chilling centre, a route, a driver. Pure service.
- Secondary — processing. At a dairy plant the milk is pasteurised, some is turned into curd, some into paneer, some into butter and ghee, some into ice cream. Every one of those changes the form of the milk. Secondary.
- Tertiary — banking, packaging supply, insurance, advertising. The dairy needs a loan to buy machines, a supplier to deliver pouches, an insurance policy against loss, and a way to tell customers the product exists. All services.
- Tertiary — retail. Finally a shopkeeper keeps the pouch cold and sells it to you at seven in the morning. Service again.
Six links. Two of them primary, one secondary, three tertiary. Now do the thought experiment that makes the point land: cut any one link. No fodder, no milk. No transport, the milk sours in the village. No dairy plant, no ghee or ice cream exists at all. No bank loan, the plant never gets built. No shop, the pouch never reaches you. Every link is load-bearing.
Forward: secondary needs primary for raw material; tertiary needs both for something to move, store, finance and sell.
Backward: primary needs secondary for tools, fertiliser, pumps and tractors, and needs tertiary for credit, transport and markets. A farmer with no bank, no road and no buyer is not really a farmer; he is a subsistence gardener.
That backward direction is the one students forget. Ask yourself: where did the farmer’s plough come from? A workshop — secondary. Where did his seed money come from? A bank or a lender — tertiary. Where did the diesel for his pump come from? A refinery — secondary — carried by a tanker — tertiary. The “simplest” sector in the economy is quietly leaning on the other two the whole time.
Question (5 marks): “The three sectors of the economy are interdependent.” Explain this statement with the help of a suitable example.
Model answer — written the way it should look in your answer sheet.
Point 1 — state the claim. The three sectors do not work in isolation; the output of one sector becomes the input of another, so each depends on the others for its survival and growth. (This opening sentence alone typically earns a mark, because it defines interdependence in economic language rather than everyday language.)
Point 2 — primary supplies secondary. A sugar mill cannot run without sugarcane, and a cotton mill cannot run without cotton. If the monsoon fails and the cane crop is poor, the mill runs below capacity and its workers lose wages. So a shock in the primary sector travels straight into the secondary sector. (Point + explanation + example = full mark.)
Point 3 — secondary supplies primary. In return, the farmer’s pump set, plough, sprayer, fertiliser and packing material are all manufactured goods. Without the secondary sector, farming would stay at the level of a wooden stick and a pair of bullocks.
Point 4 — tertiary carries both. Cane must be trucked to the mill before it dries out; sugar must be stored, financed, insured and sold. Transport, warehousing, banking and trade are what convert physical output into actual income for anyone.
Point 5 — close with the consequence. Because of this linkage, growth in one sector pulls the others up and a collapse in one drags the others down. This is exactly why planners cannot develop one sector while ignoring the rest.
Why this works: five clean points, each one stated, explained and illustrated. Notice there is no padding and no repetition. An examiner scanning quickly can see five distinct ideas in five seconds — and that is precisely what earns five marks.
Final Goods, Intermediate Goods and How GDP Is Measured
Right. Now we need to compare the three sectors — to ask which one is the biggest. And immediately we hit a problem that is worth pausing on, because it is a genuinely clever problem and understanding it makes you look like you actually know economics.
Suppose I tell you that in one year a country produced 500 tonnes of wheat, 20,000 metres of cloth, and 3 lakh haircuts. Which sector produced the most? You cannot answer. You cannot add tonnes to metres to haircuts. They are different things measured in different units. It is like being asked whether 5 kilograms is bigger than 5 kilometres.
So economists do the only sensible thing: they convert everything into money. Not because money is important in itself, but because money is a common ruler. Multiply the quantity of each thing by its price and suddenly wheat, cloth and haircuts are all measured in rupees, and rupees can be added.
The Double-Counting Problem — Slowly
Now the second problem, and this is the one that trips people up. If we are going to add up the value of everything produced, we must be very careful not to count the same value twice. Let me show you how easy it is to get this wrong.
Follow a loaf of bread backwards through a small town in one year:
- A farmer grows wheat and sells it to a flour mill for ₹20,000.
- The mill grinds it into flour and sells the flour to a bakery for ₹32,000.
- The bakery bakes bread and sells it to a shopkeeper for ₹50,000.
- The shopkeeper sells the bread to families for ₹60,000.
Now, the naive thing to do is add up all four sales: ₹20,000 + ₹32,000 + ₹50,000 + ₹60,000 = ₹1,62,000. And that number is badly, badly wrong.
Why? Because the ₹20,000 of wheat is already sitting inside the ₹32,000 of flour. The mill did not create ₹32,000 of new stuff — it bought ₹20,000 of wheat and added ₹12,000 of its own grinding work. When we counted both the wheat and the flour, we counted that wheat twice. Then we counted it a third time inside the bread, and a fourth time inside the shop price. In the end only ₹60,000 of bread actually exists in the town, but our arithmetic claimed ₹1,62,000. We have inflated the economy by counting the same wheat over and over. This error has a name: double counting.
Here is the analogy I like. Imagine measuring how tall you are by measuring your feet, then your legs, then your legs-plus-torso, then your whole body, and adding all four numbers together. You would conclude you are twelve feet tall. Obviously silly. But that is exactly what adding up every sale in the chain does.
Final Goods and Intermediate Goods
The fix is a definition. We divide goods into two kinds.
- An intermediate good is a good that is bought by one producer in order to be used up in producing something else. The wheat and the flour in our story are intermediate goods — they were bought to be turned into something else.
- A final good is a good that reaches its last user — a household that will consume it, or a producer who will use it as a lasting asset. The bread bought by families is a final good, because nothing further will be made out of it.
And then the rule that solves everything: we count only the value of final goods and services. The value of every intermediate good is already contained inside the final price, so counting it separately would be counting it twice.
What GDP Actually Is
Now we can say the big term without any fear. Gross Domestic Product (GDP) is the value of all final goods and services produced within a country during a particular year. Take that definition apart word by word, because every word is doing work:
- Value — measured in money, so different things can be added.
- All final — intermediate goods excluded, so no double counting.
- Goods and services — the tertiary sector’s output counts fully, even though you cannot touch it.
- Within a country — produced inside India’s borders. That is what “domestic” means.
- During a particular year — GDP is a flow over a period, not a stock sitting in a warehouse.
The value produced by each sector separately is called that sector’s GDP contribution, and the three added together give the country’s GDP. In India, the enormous task of measuring this is carried out by the central government, working with state governments and departments, which collect information on the total volume of goods and services and their prices. You do not need to memorise the machinery — but you should know that GDP is an estimate produced by official statistical agencies, not a number anyone can simply look up by counting.
Question (4 marks): Using the bread chain above (farmer ₹20,000 → mill ₹32,000 → bakery ₹50,000 → shopkeeper ₹60,000), find (i) the contribution to GDP, and (ii) the value added at each stage. Show that both methods agree.
Part (i) — the final-goods method. The only final good here is the bread bought by households, worth ₹60,000. Wheat, flour and the bakery’s bread-to-shop sale are all intermediate — each was bought to be turned into or resold as something else. So the contribution to GDP is ₹60,000.
Part (ii) — the value-added method. Value added at any stage = value of that stage’s output − cost of the inputs it bought.
Farmer: ₹20,000 − ₹0 = ₹20,000 (his input was land, labour and seed from his own effort)
Mill: ₹32,000 − ₹20,000 = ₹12,000
Bakery: ₹50,000 − ₹32,000 = ₹18,000
Shopkeeper: ₹60,000 − ₹50,000 = ₹10,000
Total value added = 20,000 + 12,000 + 18,000 + 10,000 = ₹60,000.
The two methods agree exactly. Compare that with the wrong answer of ₹1,62,000 you get by adding every sale — an overstatement of ₹1,02,000, which is more than the entire real output.
Why this works: the value-added method is really just the final-goods method taken apart. Each business’s slice of the ₹60,000 is exactly the bit it personally created. Add the slices, get the whole cake. If your two methods ever disagree, you have made an arithmetic error — go back and find it.
Question (4 marks): A cotton grower sells cotton for ₹500. A spinning mill turns it into yarn and sells it for ₹800. A weaving unit makes cloth and sells it for ₹1,300. A garment factory makes a shirt and sells it to a shop for ₹2,000. The shop sells it to a customer for ₹2,600. Find the contribution to GDP and the value added at each stage.
Step 1 — identify the final good. Only the shirt bought by the customer is final: ₹2,600. Everything before it was bought to be transformed or resold.
Step 2 — contribution to GDP = ₹2,600.
Step 3 — value added, stage by stage.
Cotton grower: 500 − 0 = ₹500
Spinning mill: 800 − 500 = ₹300
Weaving unit: 1,300 − 800 = ₹500
Garment factory: 2,000 − 1,300 = ₹700
Shop: 2,600 − 2,000 = ₹600
Step 4 — check. 500 + 300 + 500 + 700 + 600 = ₹2,600. Matches the final good exactly.
Step 5 — the trap. Adding all five sale values gives 500 + 800 + 1,300 + 2,000 + 2,600 = ₹7,200 — nearly three times the truth. If you ever write ₹7,200 as GDP, you have double counted.
Why this works: notice which sectors these stages belong to. Cotton growing is primary. Spinning, weaving and stitching are secondary. Retail selling is tertiary. So this single ₹2,600 shirt contributes ₹500 to primary GDP, ₹1,500 to secondary GDP and ₹600 to tertiary GDP. That is precisely how a country’s sector-wise GDP gets built — one value-added slice at a time.
Question (4 marks): In an imaginary district, the value of final goods and services produced in one year was: primary sector ₹4,500 crore, secondary sector ₹6,200 crore, tertiary sector ₹9,300 crore. (i) Find the district’s GDP. (ii) Find each sector’s percentage share. (iii) Which sector is the largest?
Step 1 — GDP. GDP = 4,500 + 6,200 + 9,300 = ₹20,000 crore.
Step 2 — the share formula. Share of a sector = (value of that sector ÷ GDP) × 100.
Primary = (4,500 ÷ 20,000) × 100 = 0.225 × 100 = 22.5%
Secondary = (6,200 ÷ 20,000) × 100 = 0.31 × 100 = 31%
Tertiary = (9,300 ÷ 20,000) × 100 = 0.465 × 100 = 46.5%
Step 3 — check. 22.5 + 31 + 46.5 = 100. Shares of parts of a whole must always total 100. If yours do not, you have made an error — find it before moving on.
Step 4 — answer (iii). The tertiary sector is the largest, contributing almost half of the district’s GDP at 46.5%.
Why this works: the “add up to 100” check is free insurance. In a board exam under time pressure, a misplaced decimal is far more likely than a misunderstood concept, and this one line catches it every time.
Question (5 marks): A small economy’s sector values (in ₹ crore) were:
Year A — primary 3,000; secondary 4,000; tertiary 5,000.
Year B — primary 3,300; secondary 4,600; tertiary 6,100.
Find GDP in each year, the growth rate of each sector, and the primary sector’s share in each year. Comment on what you notice.
Step 1 — GDP.
Year A: 3,000 + 4,000 + 5,000 = ₹12,000 crore
Year B: 3,300 + 4,600 + 6,100 = ₹14,000 crore
Step 2 — overall growth. (14,000 − 12,000) ÷ 12,000 × 100 = 2,000 ÷ 12,000 × 100 = 16.67% (to two decimals).
Step 3 — growth of each sector.
Primary: (3,300 − 3,000) ÷ 3,000 × 100 = 300 ÷ 3,000 × 100 = 10%
Secondary: (4,600 − 4,000) ÷ 4,000 × 100 = 600 ÷ 4,000 × 100 = 15%
Tertiary: (6,100 − 5,000) ÷ 5,000 × 100 = 1,100 ÷ 5,000 × 100 = 22%
Step 4 — primary sector’s share.
Year A: (3,000 ÷ 12,000) × 100 = 25.0%
Year B: (3,300 ÷ 14,000) × 100 = 23.57% (to two decimals)
Step 5 — the comment, which is where the real marks are. The primary sector’s value grew from ₹3,000 crore to ₹3,300 crore, yet its share fell from 25.0% to 23.57%. There is no contradiction. A share can fall even when the amount rises, provided the other sectors rise faster. Here tertiary grew at 22% against primary’s 10%, so tertiary claimed a bigger slice of a bigger cake.
Why this works: this is the single most misread idea in the whole chapter. When a graph shows agriculture’s share sliding downwards, students write “agricultural production has decreased”. Usually it has not — it has simply grown more slowly than everything else. Write that sentence in an exam and you will stand out.
The Historical Change in Sectors
Here is one of the most satisfying patterns in all of economics, and it is genuinely worth understanding rather than memorising, because once you understand it you can predict it. Over long stretches of history, countries tend to move through the sectors in order: first primary is biggest, then secondary takes over, then tertiary takes over. Let me explain why that happens, because the “why” is what the exam wants.
Stage One: Primary Dominates, Because It Has To
Go back a few hundred years anywhere in the world. Farming methods were simple, yields were low, and it took an enormous number of hands to feed a population. If growing enough food to feed one family takes an entire family’s labour all year, then almost everybody must farm. There is simply no spare labour for anything else. So the primary sector employs most people and produces most of the value, not because anybody chose that, but because food comes first and food was hard to get.
Think of it as a hierarchy of needs at the level of a whole country. You cannot have a nation of engineers if the nation cannot feed itself.
Stage Two: Secondary Takes Over, Because Farming Got Better
Now imagine new methods of farming arrive — better seeds, irrigation, fertiliser, machines. Suddenly the same land, worked by fewer people, produces more food. And that changes everything, because two things happen at once.
First, labour is released. If four people can now do what ten used to do, six people are free to do something else. Second, a surplus appears — more food than the farming families need themselves — which can feed those six people while they do that something else.
What did they do? Over the eighteenth and nineteenth centuries in the countries that industrialised first, they went into factories. New machines and new ways of organising work meant that manufacturing could employ vast numbers of people and produce vast quantities of goods. The secondary sector’s share of both output and employment climbed past the primary sector’s. Historians call this period the Industrial Revolution, and you will study its Indian dimension in your History book.
Stage Three: Tertiary Takes Over, Because Rich Societies Buy Services
Over the last hundred years or so, a further shift has happened in the developed countries. Manufacturing became so productive — machines doing what a hundred workers used to do — that fewer and fewer workers were needed to produce even more goods. Meanwhile, as people got richer, what they wanted more of was not another sack of grain or another cooking pot, but education, healthcare, travel, entertainment, insurance, finance and information. And factories and farms themselves needed ever more transport, storage, banking, design and advertising to function.
So the service sector became the largest producing sector, and the largest employer, in developed economies. This is not an accident and it is not a decline — it is what success looks like from the inside.
| Stage | Primary (% of GDP) | Secondary (%) | Tertiary (%) |
|---|---|---|---|
| Early — mostly agricultural | 55 | 15 | 30 |
| Middle — industry growing | 33 | 26 | 41 |
| Later — services dominant | 18 | 28 | 54 |
Question (3 marks): Using the illustrative table above, calculate the change in each sector’s share from the early stage to the later stage, and state what the pattern shows.
Step 1 — check each row totals 100. 55 + 15 + 30 = 100. 33 + 26 + 41 = 100. 18 + 28 + 54 = 100. Good, the data is internally consistent.
Step 2 — change, early to later.
Primary: 18 − 55 = −37 percentage points (a fall)
Secondary: 28 − 15 = +13 percentage points
Tertiary: 54 − 30 = +24 percentage points
Step 3 — check the changes. −37 + 13 + 24 = 0. Shares are slices of a fixed 100, so the gains must exactly cancel the losses. They do.
Step 4 — the interpretation. The primary sector’s share shrank sharply while both secondary and tertiary expanded, with the tertiary sector expanding almost twice as much as the secondary. This is the classic path of structural change: an economy moving out of agriculture, first into industry, and increasingly into services.
Why this works: notice I wrote “percentage points”, not “percent”. A fall from 55% to 18% is a fall of 37 percentage points; describing it as “a 37% fall” would mean something different and is technically wrong. Examiners who know their subject notice this, and it costs you nothing to get it right.
Rising Importance of the Tertiary Sector in India
In India, over the decades since Independence, the tertiary sector has grown to become the largest producer of value in the economy. That is a real and well-documented shift, and the exam will certainly ask you why. There are five good reasons and I want you to be able to explain each one in your own words, not just list them.
Reason 1 — Every Country Needs Basic Services
Some services are not luxuries; they are the minimum a functioning society requires. Hospitals, schools, post offices, courts, police, defence, municipal water and sanitation, banking, administration. As a country’s population grows and as it becomes more organised, these have to expand simply to keep pace. In a developing country like India, the government carries a large share of the responsibility for providing these, so a great deal of tertiary activity is government activity.
Reason 2 — Growth in Farming and Industry Pulls Services Along
This is the interdependence idea again, and it is the one students explain least well, so let me slow down. When agriculture and industry grow, they do not grow in a vacuum. More crop means more trucks, more warehouses, more cold storage, more crop loans, more insurance, more mandis, more traders. More factories means more freight, more electricity distribution, more bank credit, more accountants, more advertising, more shops to sell the output.
So the service sector grows partly because it is towed along by the growth of the other two. Transport, trade, storage and communication are, in this sense, not really separate from farming and industry at all — they are the circulation system that farming and industry cannot live without.
Reason 3 — Rising Incomes Create Demand for New Services
Think about how a family’s spending changes as its income rises. At a very low income, almost everything goes on food. As income rises, the family starts spending on things it could not previously afford: a private tutor for the children, a doctor rather than home remedies, a scooter and therefore fuel and repairs, a phone connection, an occasional restaurant meal, a bus ticket to visit relatives, a bank account, a small insurance policy.
Every one of those is a service. So as a section of the population becomes better off, demand for services rises faster than demand for basic goods. Multiply that by millions of households and you get a booming tertiary sector.
Reason 4 — The Information Technology Revolution
Over the past few decades an entirely new family of services has appeared, built on computers and communication technology. Software development, IT-enabled services, business process work, data services, digital payments, online education, e-commerce logistics — a great deal of this simply did not exist within living memory. India has become a significant location for several of these activities, and they have added substantially to the value produced by the tertiary sector.
What makes these services economically special is that they are often high value per worker: a relatively small number of people can produce a large amount of value. Keep that thought — it explains something important in a moment.
Reason 5 — And Now the Nuance That Wins Marks
Here is where a good answer separates itself from an average one. It is tempting to conclude “the service sector is booming, therefore service work is good work”. That is not true, and CBSE genuinely likes students who see this.
The tertiary sector in India is really two very different worlds wearing the same label.
- The high-skill world: software engineers, doctors, chartered accountants, bankers, teachers in well-run institutions, professionals in IT-enabled services. Few workers, high productivity, good pay, usually secure jobs.
- The survival world: the man pushing a handcart of vegetables, the woman selling lemons on a pavement, the boy washing plates in a roadside eatery, the domestic worker, the porter, the small repair-shop helper. Very many workers, very low earnings, no security whatsoever.
Both of these are counted in “the service sector”. But the second group are not there because the service sector is thriving — they are there because there was nowhere else to go. A person who cannot find work in a factory or on a farm will push a handcart rather than starve. That is not a booming sector; that is a shortage of decent jobs, hiding inside a good-looking statistic.
Question (5 marks): Explain any five reasons for the rising importance of the tertiary sector in India.
Model answer with mark annotations.
1. Basic services must expand. Hospitals, schools, post and telegraph, police, courts, defence, banking, transport and administration are necessary in any country, and in a developing country the government must provide many of them. As population and needs grow, these services expand. (1 mark — named services + reason.)
2. Development of agriculture and industry increases demand for services. Higher farm and factory output requires more transport, storage, trade, banking and insurance to move and finance it. Services therefore grow as a direct consequence of growth elsewhere. (1 mark — the link is the mark, not the list.)
3. Rising incomes create demand for new services. As incomes rise, households begin to spend on private schooling, healthcare, restaurants, tourism, shopping and personal transport, which they could not previously afford. (1 mark.)
4. New information-based services have emerged. Advances in information and communication technology have created services such as software development and IT-enabled services, which have grown rapidly and add high value. (1 mark.)
5. But growth is uneven. Not every service is expanding in the same way. Skilled services grow fast and pay well, while a very large number of people remain in low-earning service work such as vending, small repairs and domestic work, taken up only for want of better options. (1 mark — and this is the point most students miss.)
Why this works: the question says “explain”, so each numbered point does three things — states the reason, explains the mechanism, and gives a concrete instance. Bare bullet points like “IT sector” would earn perhaps half the marks.
Where Are Most of the People Employed?
We have established that the tertiary sector produces the most value in India. Now comes the question that gives this chapter its punch: do most people actually work there?
The answer, and this is the central fact of the whole chapter, is no. The primary sector’s share of GDP has fallen a great deal over the decades, but the share of workers in the primary sector has fallen far more slowly. A large proportion of India’s workforce is still engaged in agriculture and related activities, even though agriculture produces a much smaller slice of the country’s output.
Sit with that for a second, because it is strange. A sector that produces a small share of the value employs a large share of the people. What does that actually mean about the lives of those people?
| Sector | Share in GDP (%) | Share in employment (%) | What it tells you |
|---|---|---|---|
| Primary | 18 | 45 | Far more workers than output — too many people sharing too little income |
| Secondary | 28 | 25 | Roughly balanced |
| Tertiary | 54 | 30 | More output than workers — higher value produced per person |
Why has the workforce not moved out of farming the way the output has? Because the other sectors have not created enough jobs. In the countries that industrialised early, factories absorbed the people leaving agriculture. In India, industry and services have grown impressively in output, but they have not grown in employment at anything like the same rate — partly because modern industry and high-end services are capital-intensive and skill-intensive, producing a lot of value with relatively few workers. So people stay on the family land, not because there is work for them there, but because there is nothing better.
Question (5 marks): Take an illustrative economy with GDP of ₹300 lakh crore and a workforce of 60 crore people, split in the shares shown in the table above (GDP 18 / 28 / 54; employment 45 / 25 / 30). Find the value produced per worker in each sector and compare.
Step 1 — get everything into plain rupees. ₹300 lakh crore = 300 × 105 crore = 3 × 10⁷ crore, and 1 crore = 107, so GDP = 3 × 10¹⁴ rupees. Workforce = 60 crore = 6 × 10⁸ workers.
Step 2 — overall value per worker. 3 × 10¹⁴ ÷ 6 × 108 = ₹5,00,000 per worker per year.
Step 3 — primary sector. Output = 18% of 3 × 1014 = 5.4 × 10¹³. Workers = 45% of 6 × 108 = 2.7 × 10⁸. Per worker = 5.4 × 10¹³ ÷ 2.7 × 108 = ₹2,00,000.
Step 4 — secondary sector. Output = 28% = 8.4 × 10¹³. Workers = 25% = 1.5 × 10⁸. Per worker = ₹5,60,000.
Step 5 — tertiary sector. Output = 54% = 1.62 × 10¹⁴. Workers = 30% = 1.8 × 10⁸. Per worker = ₹9,00,000.
Step 6 — the comparison. ₹9,00,000 ÷ ₹2,00,000 = 4.5. A worker in the tertiary sector produces four and a half times as much value as a worker in the primary sector.
Step 7 — what to write. “Because a very large share of the workforce is producing a small share of the output, average productivity and therefore average income in the primary sector are far lower than in the other two sectors. This is a key reason why rural poverty persists even while national GDP grows.”
Why this works: the shortcut, if you spot it, is that value per worker is simply (GDP share ÷ employment share). For primary that is 18/45 = 0.4 of the average; for tertiary, 54/30 = 1.8 of the average; and 1.8 ÷ 0.4 = 4.5, exactly as computed. You do not even need the rupee figures — but showing them makes the meaning vivid.
Underemployment and Disguised Unemployment
We have just seen that far too many people are crowded into the primary sector. Now let us look closely at what that crowding does to them, because it produces a very peculiar kind of joblessness — one where everybody looks employed.
Meet the Devi family. They own two hectares of land in a village. Eight adult members of the family work on that land: father, mother, three sons, two daughters-in-law and an uncle. Every morning all eight walk out to the field. Every evening all eight walk back. If a government surveyor came and asked “are you employed?”, every one of them would say yes, and it would be true in a sense — they are all working.
But here is the thing. Two hectares of land, with the crops and methods they use, genuinely requires about four people to work it properly. Four. Not eight. The other four are, in truth, not needed. They spread the same work out thinner: three people do the weeding that one person could finish, everyone finishes early and sits under the tree, and the land produces exactly what it would have produced anyway.
Now do the crucial test. Suppose four of them left the village tomorrow and took jobs in town. What happens to the farm’s output? Nothing. The remaining four work a bit harder and produce exactly the same crop. And that is the definition.
Disguised unemployment is the extreme form of underemployment found on family farms and in small family enterprises: more people are engaged in a job than are actually required, so that if some of them were withdrawn, total output would not fall at all. It is called “disguised” precisely because the unemployment is hidden — the surplus workers look busy, and no one is officially “unemployed”.
Why does this happen? Because in a family farm nobody gets fired. The land belongs to the family; the family shares whatever the land produces. A young man who cannot find work in town does not become “unemployed” — he simply joins the family field, takes a share of the family meal, and the same crop is now divided among more mouths. His arrival adds nothing to output but reduces everyone’s per-person income. The unemployment has not disappeared; it has been absorbed and hidden.
And it is not only farming. Look for the same pattern in a small shop where three brothers sit behind a counter that one person could manage; in a family that runs a tiny eatery with more helpers than customers; in a small trading business where relatives are given “positions” because they have nowhere else to go. Same phenomenon, different setting.
Question (4 marks): Eight members of the Devi family work on two hectares and produce 60 quintals of wheat a year. The land actually needs only four workers. (i) Find output per worker now. (ii) If four members leave and output stays the same, find output per worker then. (iii) What percentage of the workforce is surplus? (iv) What is this situation called?
(i) Output per worker = 60 ÷ 8 = 7.5 quintals per worker.
(ii) Output per worker = 60 ÷ 4 = 15 quintals per worker — exactly double, even though not one extra grain of wheat was grown.
(iii) Surplus workers = 8 − 4 = 4. As a percentage: (4 ÷ 8) × 100 = 50%. Half the family’s labour on that land is contributing nothing to output.
(iv) This is disguised unemployment, also called hidden unemployment: the marginal contribution of the surplus workers to output is zero.
Why this works: part (ii) is the heart of it. Output per worker doubled without production rising by a single quintal. That is the arithmetic signature of disguised unemployment, and if you can produce that comparison in an exam, you have proved you understand it rather than merely defined it.
Question (3 marks): In a village, 8 workers each find only 4 hours of work a day, though a full working day is 8 hours. Express the labour actually used as full-time-equivalent workers and find what percentage of available labour is going unused.
Step 1 — labour actually used. 8 workers × 4 hours = 32 labour-hours per day.
Step 2 — convert to full-time workers. 32 ÷ 8 hours = 4 full-time-equivalent workers. So eight people are between them doing four people’s work.
Step 3 — labour available. 8 workers × 8 hours = 64 labour-hours.
Step 4 — unused labour. (64 − 32) ÷ 64 × 100 = 32 ÷ 64 × 100 = 50% of the village’s available labour is idle, even though the unemployment register shows zero unemployed people.
Why this works: this is why economists insist on measuring hours and not just heads. Counting heads says “8 employed, 0 unemployed”. Counting hours says “half our labour is being wasted”. Same village, completely different picture — and only one of them is honest.
One last thought before we move on, and it is the humane one. Disguised unemployment is not laziness and it is not a personal failure. It is what happens when an economy does not create enough jobs and families quietly absorb the shortfall. Every “surplus” worker in that field is a person who would take a decent job tomorrow if one existed. That is exactly why the next section — how to create employment — matters so much.
How to Create More Employment
So: too many people, too little work, especially in rural India. What can actually be done? This is a favourite 5-mark question and it has a beautiful internal logic, which I want you to see rather than memorise. Every good answer follows the same thread: help the farmer produce more, then help him process and sell what he produces, then build the services that make both possible.
1. Irrigation — Turning One Crop Into Two
Start with the simplest and most powerful idea in rural employment. A farmer who depends only on rain grows one crop a year. For the remaining months, his land is bare and he and his family have nothing to do — classic seasonal underemployment. Now give that farmer a well, a tube well, a canal or a check dam. He can now grow a second crop, sometimes a third. Suddenly the idle months become working months, for him and for anyone he hires.
Notice the chain of effects: irrigation raises output, raises income, employs family labour year-round, and creates paid work for landless labourers in the village who previously migrated in the lean season. One investment, four benefits. If a government or a bank spends money on constructing a dam, digging canals or subsidising wells, it is simultaneously providing employment during construction and permanently raising employment afterwards.
2. Cheap Credit — Because Poverty Is Also a Cash-Flow Problem
A small farmer who wants to buy seeds, fertiliser and a pump needs money before the harvest, and he will only have money after it. That gap is where poverty gets locked in. If the only lender in the village is a moneylender charging punishing interest, then even a good harvest goes into repaying the loan, and the farmer starts the next season exactly as poor as before.
Provide crop loans through banks and cooperative societies at reasonable rates of interest, and the whole cycle changes. The farmer invests, produces more, repays comfortably and keeps a surplus — and that surplus is what he uses to expand and to hire. Credit is not charity; it is the pipe through which every other improvement flows.
3. Transport and Storage — Because Growing It Is Only Half the Job
Picture a farmer with a splendid crop of tomatoes and no road out of his village. He must sell to whoever comes to the village gate, at whatever price is offered, before the tomatoes spoil. Build an all-weather road and he can reach a town market. Build a cold store and he can wait for a better price instead of selling in panic.
Both of these create employment twice over: jobs in building and running the roads, trucks and warehouses, and better incomes for farmers, which they then spend locally, creating still more work. This is the tertiary sector doing what it does best — making the other sectors possible.
4. Local Processing Industries — Keeping the Value in the Village
This is the most under-used answer and the one that impresses examiners. At present a village often sells raw produce cheaply and buys back the processed version expensively. Tomatoes leave at a low price; ketchup comes back at a high one. All the value added in between — and all the jobs that created it — happened somewhere else.
Set up small processing units in or near the village: a dal mill, an oil expeller, a fruit-pulp unit, a milk chilling and packing plant, a jaggery unit, a honey-bottling shed. Now the value added stays local and the jobs stay local. Remember Example 6? The cotton grower earned ₹500 while the spinning, weaving and stitching stages together earned ₹1,500. Local processing is simply the policy of trying to capture more of that ₹1,500 where the raw material is grown.
5. Tourism and Regional Crafts — Employment From What a Place Already Has
Many parts of India have something a visitor would travel to see: a fort, a wetland full of birds, a hill route, a temple, a beach, a festival, a distinctive craft or cuisine. Developing these thoughtfully creates work for guides, drivers, cooks, homestay owners, artisans, shopkeepers and performers — and much of it is work that does not need years of formal qualification, which matters enormously in areas where schooling has been limited. Regional crafts and handloom similarly turn local skill into local income.
6. Education and Health — Jobs That Create More Jobs
Here is a thought that surprises students. Suppose a country decides that every child should be in school and every village should have a functioning health centre. To deliver that, it must hire teachers, headmasters, doctors, nurses, health workers, pharmacists, lab technicians, cleaners and administrators — and it must build the schools and clinics they work in. That is a very large amount of direct employment, created simply by deciding to provide a service properly.
And then the second effect, which is the bigger one: educated, healthy people are more productive workers for the rest of their lives. Spending on education and health is therefore both an immediate job-creation programme and a long-term investment in the country’s capacity to produce. Very few policies do both at once.
Question (5 marks): Suggest and explain any five ways by which more employment can be created in the rural areas of India.
1. Provide irrigation facilities. If the government or banks help farmers construct wells, tube wells and canals, land that produced one rain-fed crop can produce two or three. This gives work to the farming family and to landless labourers through the year instead of only in one season. (Point + mechanism + who benefits.)
2. Make cheap credit available. Crop loans from banks and cooperative societies at low interest allow small farmers to buy seeds, fertiliser and equipment without falling into the grip of moneylenders. Higher production means higher income and more hired labour.
3. Improve transport and storage. All-weather roads and warehouses let farmers reach distant markets and hold their produce until prices are favourable. Building and running this infrastructure itself employs a large number of workers.
4. Set up local processing industries. Dal mills, oil expellers, fruit-processing units and dairy plants located near the villages allow raw produce to be converted into higher-value goods locally, so that both the additional value and the additional jobs remain in the rural area.
5. Invest in education, health and tourism. Opening schools and health centres directly employs teachers, doctors and support staff, and produces a healthier, better-trained workforce. Developing tourism and regional crafts creates work for guides, transport operators, artisans and small traders using resources the region already possesses.
Why this works: five distinct measures, none overlapping, each explained through its mechanism rather than merely named. Note the structure of every point — what to do → how it produces work → who gets the work. Repeat that pattern and you will rarely lose a mark on this question.
MGNREGA and the Right to Work
Everything we have said so far describes what ought to happen. India also has a law that turns part of it into a legal entitlement, and this is the one piece of policy this chapter expects you to know.
The Mahatma Gandhi National Rural Employment Guarantee Act — you will see it written as MGNREGA, and the programme run under it as MGNREGS — implements what is often called the right to work. In broad terms, the law guarantees rural households a stated number of days of wage employment in a financial year (100 days is the figure most commonly cited in textbooks) if their adult members volunteer to do unskilled manual work, and it provides that if such employment is not made available within the prescribed period, an unemployment allowance becomes payable.
Read that sentence again and notice what makes it unusual. It is not a promise, a target or a scheme that may or may not reach you. It is framed as a legal entitlement that a household can demand. That shift — from “the government will try to help” to “you may ask, and it must be provided” — is the conceptual heart of the idea, and it is what an examiner wants you to articulate.
Why does such a law exist at all? Go back to the underemployment section. A landless labourer in a village typically has plenty of work in the sowing and harvest weeks and almost none in between. In those lean months the family has no income, and the classic responses are to borrow at ruinous interest, sell an asset, migrate in distress, or simply eat less. A guaranteed number of days of paid work in the lean season is designed to break exactly that cycle.
Question (3 marks): A village has 250 rural households. Assume each household takes up the full entitlement of 100 days of wage employment in a year, and assume an illustrative daily wage of ₹250. Calculate (i) the maximum person-days of employment generated and (ii) the total wage payment.
Step 1 — person-days. A “person-day” is one person working for one day. 250 households × 100 days = 25,000 person-days.
Step 2 — wage bill. 25,000 person-days × ₹250 per day = ₹62,50,000 = ₹62.5 lakh.
Step 3 — interpret it. That is roughly ₹25,000 of guaranteed annual income reaching each participating household (₹62,50,000 ÷ 250 = ₹25,000), concentrated in the months when farm work is scarce.
Note on the figures: the 250 households and the ₹250 wage are illustrative numbers used for the calculation only. Actual notified wage rates differ by state and are revised periodically — check the current official rate before using one.
Why this works: “person-days” is the unit employment programmes are actually measured in, and once you see it is just people × days, data questions using it stop being intimidating. The final division back to per-household income is the step that turns a number into a meaning — always take it.
Question (3 marks): What is meant by the “right to work” in the Indian context? State any two features of the law that implements it.
Meaning. The right to work means that wage employment is treated as a legal entitlement of rural households rather than as a discretionary favour: the state undertakes to provide a guaranteed number of days of employment, and where it fails to do so within the prescribed time, an unemployment allowance becomes payable. (1 mark — note the words “legal entitlement”; that phrase is doing the work.)
Feature 1. It applies to rural households whose adult members volunteer to do unskilled manual work, and provides for a stated number of days of wage employment in a financial year (commonly cited as 100 days). (1 mark.)
Feature 2. The employment is directed towards productive works such as water conservation, land development and rural connectivity, so that the programme creates durable assets that raise future productivity alongside providing immediate income. (1 mark.)
Why this works: the answer is precise about the entitlement, gives two genuinely different features (one about who and how much, one about what kind of work), and avoids any claim about performance or politics. In a board answer on public policy, factual and neutral is not only safer — it is also what the marking scheme rewards.
Division of Sectors as Organised and Unorganised
Take a breath — we are now starting a completely new way of slicing the same economy, so clear your head of primary, secondary and tertiary for a moment. Those three answered the question “what kind of work is it?”. This new division answers a different question: “what are the terms of employment like?”
Meet two people who both, technically, “work in a shop”.
Ravi works at a large chain store. He has a letter of appointment. His hours are fixed — if he stays late, he is paid overtime. He gets a weekly day off, paid leave when he is ill, and a holiday when there is a festival. Money goes into a provident fund every month for his retirement. If the company wants to dismiss him, there are rules it must follow.
Sunita works at a small shop down the road. There is no appointment letter; the owner said “come from tomorrow” and she came. She works whatever hours the shop is open, which some days is twelve. There is no overtime, no paid leave, and if she is ill she simply does not earn that day. There is no provident fund and no pension. If business is slow next month, the owner will tell her not to come, and that will be that.
Same industry. Same city. Two utterly different working lives. Ravi is in the organised sector; Sunita is in the unorganised sector.
The unorganised sector is characterised by small and scattered units that are largely outside the control of government. Rules exist on paper but are often not followed, because the units are tiny, numerous and difficult to regulate. Employment is not secure, and workers can be asked to leave without any reason.
The word “organised” refers to organisation and regulation, not to size or to how neat the workplace looks.
| Basis | Organised Sector | Unorganised Sector |
|---|---|---|
| Registration | Registered with the government; must follow rules laid down in various laws | Small, scattered units, largely outside government control; rules often not followed |
| Terms of employment | Regular and formal; usually a written appointment letter | Irregular and informal; often only a verbal understanding |
| Job security | Secure; dismissal must follow prescribed procedure | Insecure; a worker may be asked to leave without reason |
| Working hours | Fixed; work beyond them is paid as overtime | Long and variable; extra hours usually unpaid |
| Benefits | Paid leave, holidays, medical benefits, provident fund, gratuity, pension | Few or none; illness usually means loss of a day’s earnings |
| Typical earnings | Regular salary, paid monthly | Low and irregular; often daily or piece-rate |
| Examples of workers | Government employees, teachers in registered schools, bank staff, workers in registered factories | Farm labourers, construction workers, street vendors, domestic workers, small-workshop helpers, home-based artisans |
Now the number that should make you sit up. A very large majority of India’s workers — the great bulk of the workforce — are in the unorganised sector. When you read that the Indian economy is growing, remember that most of the people doing the growing are working like Sunita, not like Ravi.
Question (4 marks): In an illustrative survey of 500 workers in a town, 60 were found to be in the organised sector and the rest in the unorganised sector. (i) Find the percentage in each. (ii) Classify these three workers under both systems of division: a woman rolling incense sticks at home; a nurse employed in a government hospital; a labourer loading sacks at a private, unregistered godown.
(i) Step 1 — find the unorganised number. “The rest” = 500 − 60 = 440 workers.
Step 2 — percentages. Organised = (60 ÷ 500) × 100 = 12%. Unorganised = (440 ÷ 500) × 100 = 88%. Check: 12 + 88 = 100. ✓
(ii) The incense-stick maker: she changes the form of raw materials into a product, so secondary; she works at home for a piece rate with no registration, contract or benefits, so unorganised.
The government nurse: she provides a service, so tertiary; she is a regular government employee with fixed hours, paid leave and a pension, so organised.
The godown labourer: loading and storing goods is a support service, so tertiary; the unit is unregistered and his work is casual and insecure, so unorganised.
Why this works: for every worker you answer two independent questions — what is being produced? gives the sector, and are the terms of employment regular and regulated? gives organised or unorganised. Answer them separately and you will never mix the two systems up again.
How to Protect Workers in the Unorganised Sector
If most of the workforce is unorganised, and unorganised work is insecure and poorly paid, then protecting these workers is not a side issue — it is one of the central economic problems of the country. Let us look at who these workers are, and then at what protection actually means.
In Rural Areas
The overwhelming majority of rural unorganised workers are landless agricultural labourers and small and marginal farmers, along with sharecroppers and artisans such as weavers, blacksmiths, carpenters and potters.
Think about what a small farmer’s year looks like. He needs money at sowing time and receives it only at harvest. If the rain fails or a pest arrives, he has no cushion at all. He is competing against far larger producers. He often cannot get a bank loan easily, so he borrows privately at high interest. So protection here means very practical things: timely and affordable credit; assured supply of seeds and inputs; irrigation; a road to a real market; and storage so he is not forced to sell the day he harvests. For the landless labourer it means guaranteed days of work in the lean season and enforcement of minimum wages.
In Urban Areas
Urban unorganised workers are found mainly in small-scale industry, in construction, in trade and transport, and in a large number of services. Picture them: workers in small workshops and units; construction labourers who move from site to site; head-loaders and porters; street vendors; rag pickers; rickshaw pullers; domestic workers; helpers in small eateries; home-based workers such as those who stitch garments, roll bidis, make agarbattis or do embroidery on a piece-rate basis.
For them, protection means: support and cheap credit for small-scale units so they can survive and pay decently; regular payment of at least the minimum wage; safe working conditions, which matters enormously in construction; some cover for accident, illness and old age; and, for street vendors, a recognised place to trade so they are not simply moved on.
The Social Dimension — Who Ends Up Here
This part of the chapter is important and I want you to read it carefully, because it is about fairness rather than arithmetic.
Unorganised-sector workers are not a random cross-section of India. Members of Scheduled Castes, Scheduled Tribes and Other Backward Classes, and a large proportion of women workers, are found disproportionately in this sector. So the disadvantages of unorganised work — low wages, no security, no benefits — land most heavily on groups that already face social disadvantage. Economic insecurity and social discrimination reinforce each other.
That is why protecting unorganised workers is described not only as an economic necessity but as a matter of social justice. Improving conditions in this sector is one of the most direct ways of reducing inequality between social groups, because it reaches precisely the people who have the least.
Protection of the worker: minimum wages actually paid, reasonable hours, safe conditions, and some form of social security for illness, accident and old age.
Fair treatment for disadvantaged groups: because women and members of SC, ST and OBC communities form a large share of these workers, protection here is also a step towards social equality.
Structure a 5-mark answer along those three layers and it will read like a plan rather than a list.
Question (5 marks): Why do workers in the unorganised sector need protection? Explain with reference to both rural and urban workers.
1. Employment is insecure. There is usually no appointment letter and no procedure for dismissal, so a worker can be asked to leave at any time without reason, losing all income overnight. (1 mark.)
2. Wages are low and irregular. Earnings are often below what the law prescribes and are paid daily or by the piece, so a worker cannot plan or save, and a single illness wipes out that day’s income. (1 mark.)
3. There are no benefits and no safety net. Paid leave, medical benefits, provident fund and pension are absent, and conditions in occupations such as construction can be unsafe, leaving families exposed to accident and old age. (1 mark.)
4. Rural workers face specific vulnerabilities. Small and marginal farmers, sharecroppers and landless labourers face seasonal work, dependence on rainfall and high-interest private borrowing; they need cheap credit, inputs, irrigation, storage and market access, and labourers need guaranteed work in lean months. (1 mark.)
5. Urban workers and the social dimension. Workers in small workshops, construction, trade, transport and services, including street vendors, domestic workers and home-based workers, need support for their units, minimum wages and safe conditions. Since a large proportion of these workers belong to Scheduled Castes, Scheduled Tribes and Other Backward Classes, and a large share are women, protecting them is a question of social justice as well as economics. (1 mark.)
Why this works: the question asks about both rural and urban, so the answer explicitly devotes a point to each — ignoring half the question is the fastest way to lose marks even when everything you wrote was correct. Always underline the two or three demands hidden inside a question before you begin writing.
Sectors in Terms of Ownership: Public and Private
Third and last way of slicing the economy, and this one is the easiest. Forget what is produced and forget the terms of employment. Ask only: who owns the assets and who delivers the service?
- In the public sector, the government owns most of the assets and provides the services. Railways, post offices, government hospitals and schools, state electricity boards, defence establishments.
- In the private sector, ownership of assets and delivery of services is in the hands of private individuals or companies. A private mill, a private hospital, a private school, a shop, a private bank.
But the interesting part is not the definition — it is the difference in purpose, and everything else follows from it.
| Basis | Public Sector | Private Sector |
|---|---|---|
| Ownership | Government owns most of the assets | Individuals or companies own the assets |
| Main aim | Public welfare | Earning profit |
| Pricing | May charge little or nothing; can operate at a loss if the service is essential | Charges a price that covers cost and yields a profit |
| Where it goes | Also to remote and unprofitable areas, because people there need the service | Mainly where there is enough paying demand |
| Examples | Railways, post office, government schools and hospitals, defence, public irrigation projects | Private factories, private banks, private schools and hospitals, shops, IT companies |
Why the Government Must Take On Some Activities
Here are four reasons, and I want you to feel the logic of each rather than memorise them.
Reason 1 — some things cost too much for anyone else to build. Consider a dam, a national highway network, a port, a railway line. The investment is enormous and returns come back only over decades, if at all. No private business can normally raise that money for that long with such uncertain returns. Yet without them, farms cannot irrigate and factories cannot move goods. So the government builds them, and the whole economy uses them.
Reason 2 — some activities must be provided at a price people can afford. Electricity is the classic case. It may cost a great deal to generate and transmit power to distant villages, and a purely commercial supplier would either charge more than farmers could pay or simply not go there. If the government supplies it at a reasonable rate, farming, small industry and household life all become possible. Supporting an activity because the rest of the economy depends on it is a public-sector job by nature.
Reason 3 — some things are basic rights, not products. Education and healthcare are not ordinary goods to be bought only by those who can pay. A country that leaves them entirely to the market ends up with children out of school and sick people untreated — which is both unjust and, in the long run, economically self-defeating, since an uneducated and unhealthy population cannot be productive. The same applies to safe drinking water, sanitation, housing for the poor, nutrition for children, and support for the elderly and the destitute.
Reason 4 — some groups need protection the market will not give. Buying foodgrain from farmers at a fair announced price, storing it, and selling it to consumers at a controlled price through ration shops is something no profit-seeking firm would do. The government does it to protect farmers from a price crash and consumers from hunger at the same time.
Question (5 marks): Why is it necessary for the government to undertake certain economic activities? Explain with examples.
1. Heavy infrastructure requires huge investment. Dams, highways, ports and railways need very large sums and yield returns only over long periods, which private enterprises are generally unable or unwilling to commit. The government builds them, and every farm and factory benefits. (1 mark.)
2. Some services must be supplied at affordable rates. Supplying electricity or irrigation water at a reasonable price may not be commercially profitable, but it enables agriculture and small industry to function. The government therefore bears part of the cost. (1 mark.)
3. Education and health are essential for human development. Every child has a right to schooling and every citizen to basic healthcare. Leaving these entirely to private provision would exclude those who cannot pay, so the government runs schools, hospitals and health centres. (1 mark.)
4. Weaker sections need protection. Buying foodgrain from farmers at a fair price and distributing it through ration shops protects farmers from distress sales and consumers from high prices — something no profit-seeking firm would undertake. (1 mark.)
5. Overall welfare and balanced development. Since the private sector concentrates where demand can pay, the government must ensure that remote regions and poorer communities also receive services such as safe drinking water, sanitation, housing and nutrition, so that development is shared rather than concentrated. (1 mark.)
Why this works: each point identifies a specific failure that would occur without government action, then names the remedy and an example. That “what would go wrong” structure is far more persuasive than simply listing government departments, and it is exactly the reasoning a marking scheme is looking for.
How to Answer Sectors Questions in the Board Exam
You now know the economics. This section is about not losing marks you have already earned — which, honestly, is where most students bleed points.
The 3-Mark Answer
Three marks almost always means three separate points. Not one point explained beautifully three times. Structure each point in one line of three parts:
- Point — the idea, stated in a short sentence. Start it with a bold or underlined key phrase.
- Explain — one sentence saying why or how.
- Example — a concrete instance in a few words.
So instead of “The tertiary sector is important because it helps other sectors”, write: “Transport services support production. Goods produced on farms and in factories have no value until they reach buyers, so trucking and storage convert output into income. For example, tomatoes grown in a village reach a city market only because of transport.” One point, three parts, one mark, ten seconds of the examiner’s time. Aim for three to four lines per point.
The 5-Mark Answer
Same structure, five points, plus two extras that cost almost nothing:
- Open with a one-line definition or framing sentence. If the question is about the unorganised sector, define it in a line before you start listing. It orients the examiner and often earns credit on its own.
- Number your points 1 to 5 and give each a bold opening phrase. An examiner marking hundreds of scripts should be able to see your five points without reading a word.
- Answer every part of the question. If it says “rural and urban”, write about both. If it says “with examples”, give examples. Underline the demands in the question before you begin.
- Close with one sentence of consequence if you have time — “This is why…” — which shows you understood rather than reproduced.
Bar Graphs, Tables and Case Studies — A Reliable Method
Data questions frighten students, but they follow a completely predictable routine. Use this every single time:
- Read the title, the axes and the units first. Thirty seconds here saves you from the commonest disaster of all — answering about employment when the graph shows GDP. Ask: what is measured, in what unit, for which years?
- Note whether the bars are percentages or absolute values. If they are percentage shares, they must total 100 for each year. If they are rupee values, they need not.
- Describe the pattern before you calculate anything. “The primary sector’s share falls steadily while the tertiary sector’s rises.” Many questions want exactly this and nothing more.
- Do the arithmetic only from the numbers given. Never import a figure you memorised elsewhere. If the graph says 20%, use 20%.
- Use “percentage points” for changes in shares and “per cent” for growth in values. Getting this right marks you out.
- Finish with one sentence of meaning. Every data question secretly asks “so what?” — a gap between GDP share and employment share means low income per worker; a rising tertiary share means structural change.
2. Writing “agricultural production has fallen” when a graph shows agriculture’s share falling. Share and amount are different things.
3. Saying “the unorganised sector” when you mean “the primary sector”. Two different classifications.
4. Defining disguised unemployment as “people with no work”. They do work — they are simply surplus, and removing them would not reduce output.
5. Quoting a memorised percentage for India’s current sectoral shares. Describe the pattern; use only the figures printed in the question.
6. Giving four points for a five-mark question because you ran out of ideas. Keep the six-word hook — water, money, road, mill, visitor, school — ready for employment questions.
Question (4 marks): A bar graph shows, for one year, the share in GDP and the share in employment of the three sectors as follows — Primary: GDP 18%, employment 45%; Secondary: GDP 28%, employment 25%; Tertiary: GDP 54%, employment 30%. (i) Verify the data. (ii) Which sector shows the largest gap? (iii) What does this gap indicate? (iv) Suggest one remedy.
(i) Verify. GDP shares: 18 + 28 + 54 = 100. ✓ Employment shares: 45 + 25 + 30 = 100. ✓ Both sets are complete percentage distributions, so nothing is missing.
(ii) Largest gap. Primary: 45 − 18 = 27 percentage points more employment than output. Secondary: 28 − 25 = 3 points more output than employment. Tertiary: 54 − 30 = 24 points more output than employment. The primary sector shows the largest gap, and it is a gap in the unfavourable direction.
(iii) What it indicates. Nearly half the workforce produces less than a fifth of the output, so value produced per worker — and therefore average income — is far lower in the primary sector. Its share of output relative to its share of workers is 18/45 = 0.4, against 54/30 = 1.8 for the tertiary sector, a ratio of 4.5 to 1. It also indicates surplus labour on farms, that is, underemployment and disguised unemployment.
(iv) One remedy. Create productive non-farm employment in rural areas — for example, by setting up local processing units such as dal mills and dairy plants, so that surplus farm workers can move into higher-value work without leaving their region.
Why this works: every number used comes from the question itself, the totals are verified first, “percentage points” is used correctly for gaps, and the answer ends with meaning and a remedy rather than trailing off after the arithmetic. That is a full-marks data answer.
Practice Worksheet with Answers
Ten original questions, arranged the way a board paper is: short objective questions first, then three-mark, then five-mark, and a data-based case study at the end. Please attempt each one on paper before you click “Show Answer”. Reading a solution feels like learning; producing one actually is learning. That gap is where marks live.
Q1. (1 mark) Which one of the following is an activity of the primary sector?
- Extracting salt from seawater in a coastal pan
- Rolling steel sheets in a mill
- Delivering a parcel across the city
- Repairing a mobile phone
Answer: (a) Extracting salt from seawater in a coastal pan.
Reason: the salt is obtained directly from a natural resource — seawater and sunshine do the work, and the salt-pan worker collects it. Option (b) changes the form of steel, so it is secondary. Options (c) and (d) produce no good at all; delivery and repair are services, hence tertiary.
Q2. (1 mark) A good that is purchased by one producer and completely used up in producing another good during the same year is called:
- A final good
- An intermediate good
- A capital good
- A public good
Answer: (b) An intermediate good.
Reason: its value is used up inside the value of the final product, which is exactly why it is excluded from GDP — counting it separately would mean counting the same value twice. Remember that nothing is intermediate by nature: sugar bought by a household is a final good, while the identical sugar bought by a sweet shop to make barfi is intermediate. The buyer’s purpose decides.
Q3. (1 mark) In which of the following is the main aim public welfare rather than profit?
- A private garment factory
- A privately owned coaching institute
- A government-run primary health centre
- A shop selling mobile phones
Answer: (c) A government-run primary health centre.
Reason: in the public sector the government owns the assets and provides the service, and the objective is the welfare of the people rather than profit — which is why such a centre may charge little or nothing and may operate in a remote area where no private provider would go. All the other options are private-sector activities whose normal objective is to earn profit.
Q4. (1 mark) Assertion (A): Over the decades, the share of the primary sector in India’s GDP has declined.
Reason (R): This is because the total production of the primary sector has fallen.
Choose the correct option:
- Both A and R are true, and R correctly explains A
- Both A and R are true, but R does not explain A
- A is true but R is false
- A is false but R is true
Answer: (c) A is true but R is false.
Reason: the primary sector’s share has indeed declined, but not because its production fell. Production has generally risen; it has simply risen more slowly than production in the secondary and tertiary sectors, so its slice of a growing total has shrunk. Recall the worked example where a sector’s value rose from ₹3,000 crore to ₹3,300 crore while its share fell from 25.0% to 23.57%. A falling share does not mean falling output — this is the single most common misreading in the whole chapter.
Q5. (3 marks) A butcher sells hides to a tannery for ₹300. The tannery makes leather and sells it to a shoe factory for ₹700. The factory makes shoes and sells them to a shop for ₹1,500. The shop sells the shoes to customers for ₹2,000. (i) What is the contribution of this chain to GDP? (ii) Calculate the value added at each stage and verify your answer. (iii) What error would you make by adding all four sale values?
(i) Contribution to GDP = ₹2,000. Only the shoes bought by customers are a final good. The hides, the leather and the factory-to-shop sale are all intermediate, because each was bought in order to be transformed or resold.
(ii) Value added = output value − cost of inputs bought.
Butcher: 300 − 0 = ₹300
Tannery: 700 − 300 = ₹400
Shoe factory: 1,500 − 700 = ₹800
Shop: 2,000 − 1,500 = ₹500
Verification: 300 + 400 + 800 + 500 = ₹2,000, which equals the value of the final good. The two methods agree, so the working is correct.
(iii) Adding all four sale values gives 300 + 700 + 1,500 + 2,000 = ₹4,500, which is more than twice the true figure. This error is called double counting: the ₹300 of hides is already inside the ₹700 of leather, which is already inside the ₹1,500 of shoes, and so on, so the same value is counted again and again.
Q6. (3 marks) Distinguish between the organised and the unorganised sector on any three bases. Give one example of a worker from each.
1. Registration and regulation. Organised-sector enterprises are registered with the government and must follow rules laid down in various laws. Unorganised-sector units are small, scattered and largely outside government control, so rules exist on paper but are frequently not followed.
2. Terms of employment and job security. In the organised sector employment is regular, usually supported by a written appointment letter, and a worker cannot be dismissed except by a prescribed procedure. In the unorganised sector employment is informal and insecure, and a worker may be asked to leave without any reason.
3. Working conditions and benefits. Organised-sector workers have fixed hours, paid overtime, paid leave, holidays, medical benefits, provident fund and often a pension. Unorganised-sector workers usually have long and variable hours with no paid overtime, and no leave, provident fund or pension — a day of illness simply means a day of lost earnings.
Examples. Organised: a teacher in a registered school, or a clerk in a bank. Unorganised: a construction labourer working on daily wages, or a street vendor.
Note for the exam: present this as a comparison, dealing with both sectors under each basis. Writing three sentences about the organised sector and then three about the unorganised sector is weaker, because the examiner has to do the comparing for you.
Q7. (3 marks) Ten members of a farming family work on three hectares of land and produce 90 quintals of grain in a year. In fact, only six workers are required to cultivate that land. (i) Find the output per worker at present. (ii) If four members leave for jobs elsewhere and output remains unchanged, find the new output per worker. (iii) Name and define the situation that exists on this farm.
(i) Output per worker = 90 ÷ 10 = 9 quintals per worker.
(ii) After four leave, six workers remain and output is still 90 quintals. Output per worker = 90 ÷ 6 = 15 quintals per worker. Note that output per worker has risen sharply even though not a single extra quintal was produced. The surplus workers were 10 − 6 = 4, that is, 40% of the workforce on that farm.
(iii) This is disguised unemployment (also called hidden unemployment). It is a situation in which more people are engaged in a job than are actually required, so that if some of them were withdrawn, total output would not fall at all. It is described as “disguised” because all ten members appear to be employed and none is recorded as unemployed, although the work of four of them adds nothing to production. It is commonly found on small family farms, where the family shares both the work and the produce and nobody can be dismissed.
Q8. (5 marks) “Both the public sector and the private sector are necessary for a country’s development.” Explain this statement by giving five points of difference between them, with examples.
Opening line. The public and private sectors are distinguished by who owns the assets and provides the services, and by the objective each pursues; a developing economy needs both, because each is suited to a different kind of task.
1. Ownership. In the public sector the government owns most of the assets and provides the services, as with the railways or a government hospital. In the private sector assets are owned and services delivered by individuals or companies, as with a private textile mill.
2. Objective. The public sector aims at public welfare, whereas the private sector normally aims at earning profit. This single difference explains almost all the others.
3. Pricing and willingness to bear losses. The public sector may supply a service at a low price or free, and may accept a loss where the service is essential — for instance supplying electricity or irrigation water to farmers at affordable rates. A private firm must charge a price that covers its costs and yields a profit.
4. Reach. The public sector extends services to remote regions and to poorer communities where there is little paying demand, such as a post office or health centre in a distant village. The private sector concentrates where demand can pay.
5. Scale of investment undertaken. Projects such as dams, ports, national highways and railway networks require enormous investment with returns spread over decades; the government undertakes these, and the industries and farms of the whole country then use them. Private enterprise typically supplies goods and services where investment is recovered within a shorter period, and contributes efficiency, innovation and the bulk of ordinary production.
Conclusion. Development therefore requires both: the private sector for production and efficiency, and the public sector for infrastructure, essential services such as education and health, and protection of weaker sections. (Keep this answer factual and neutral; avoid praising or criticising any government or party.)
Q9. (5 marks) In an imaginary state, the value of final goods and services produced in a year was: primary sector ₹1,200 crore, secondary sector ₹1,800 crore, tertiary sector ₹3,000 crore. (i) Calculate the state’s GDP. (ii) Find the percentage share of each sector and verify your result. (iii) Which sector is the largest producer? (iv) If 55% of the state’s workers are in the primary sector, what does a comparison with your answer to (ii) tell you? (v) Suggest one measure to correct this situation.
(i) GDP = 1,200 + 1,800 + 3,000 = ₹6,000 crore.
(ii) Shares (share = value ÷ GDP × 100):
Primary = (1,200 ÷ 6,000) × 100 = 20%
Secondary = (1,800 ÷ 6,000) × 100 = 30%
Tertiary = (3,000 ÷ 6,000) × 100 = 50%
Verification: 20 + 30 + 50 = 100. ✓
(iii) The tertiary sector is the largest producer, contributing half of the state’s GDP.
(iv) The comparison. The primary sector employs 55% of the workers but produces only 20% of the output — a gap of 55 − 20 = 35 percentage points in the unfavourable direction. This means the value produced per worker, and therefore the average income, is much lower in the primary sector than elsewhere. It also indicates surplus labour on the land, that is, underemployment and disguised unemployment: more people are engaged in farming than the work actually requires.
(v) One measure. Create productive employment outside farming within the rural area itself — for example by setting up local processing units such as dal mills, oil expellers and dairy plants, supported by cheap credit, so that surplus farm workers move into higher-value work without having to migrate. (Any one well-explained measure from the list — irrigation, cheap credit, transport and storage, local processing, tourism and crafts, or education and health — is acceptable.)
Q10. (4 marks — case study) Read the data and answer the questions that follow.
The table below gives, for one year, the percentage share of each sector in a country’s GDP and in its total employment.
Primary: GDP 20%, employment 44% | Secondary: GDP 26%, employment 25% | Tertiary: GDP 54%, employment 31%
(i) Verify that both sets of figures are complete. (ii) Calculate the gap between the GDP share and the employment share for the primary and the tertiary sectors, and state which way each gap runs. (iii) Which sector produces the most value per worker, and roughly how many times more than the primary sector? (iv) State one conclusion a policymaker should draw from this table.
(i) Verification. GDP shares: 20 + 26 + 54 = 100. ✓ Employment shares: 44 + 25 + 31 = 100. ✓ Both are complete percentage distributions, so no sector is missing from the data.
(ii) Gaps.
Primary: employment share − GDP share = 44 − 20 = 24 percentage points, with employment exceeding output — an unfavourable gap.
Tertiary: GDP share − employment share = 54 − 31 = 23 percentage points, with output exceeding employment — a favourable gap.
(For completeness, the secondary sector’s gap is only 26 − 25 = 1 percentage point, so it is almost balanced.)
(iii) Value per worker. Value produced per worker is proportional to (GDP share ÷ employment share).
Primary: 20 ÷ 44 = 0.455
Secondary: 26 ÷ 25 = 1.040
Tertiary: 54 ÷ 31 = 1.742
The tertiary sector produces the most value per worker, and 1.742 ÷ 0.455 = about 3.8 times as much per worker as the primary sector.
(iv) Conclusion for a policymaker. Nearly half the workforce is producing only a fifth of the output, so incomes in the primary sector must be very low and a great deal of labour there is surplus to requirement. The priority is therefore to create productive employment outside agriculture — particularly in rural areas, through irrigation, cheap credit, transport and storage, local processing industries, and investment in education and health — so that workers can move into activities where each of them produces, and earns, considerably more.
Now mark yourself honestly. Anything below 60% on your first attempt is completely normal and tells you nothing about your ability — it only tells you which sections to reread. Write those section names on a slip of paper, work through only those, and try the worksheet again in three days. The second attempt is where the real gain happens.
One Last Thing Before You Go
I want to leave you with something that has nothing to do with sectors and everything to do with how you study.
There is a Japanese word, kaizen, which means improvement so small that it barely feels like improvement at all — and doing it every single day. Not a heroic all-night session before the exam. Not “I will finish the whole Economics book on Sunday”. Just: one more correct question today than yesterday.
Think about what that actually means. If you got four of these ten right today, you are not aiming for ten tomorrow. You are aiming for five. And then six. A student who improves by one question a day for a month has moved further than a student who panics brilliantly for two nights in April. The first student also sleeps better, which turns out to matter more than anyone tells you.
You have just worked through a chapter about an economy where far too many people are doing far too little work on far too little land, and about what it takes to move a person into work where they produce more. There is a small echo of that in your own studying. The point is never to sit at the desk for more hours. The point is to make each hour produce more. One clear concept, one honest attempt, one corrected mistake — that is a productive hour, and three of those beat a whole numb afternoon.
So close this page, take out a blank sheet, and without looking, write down the three sectors, the two divisions, and one thing you can do about disguised unemployment. Whatever you cannot recall, that is tomorrow’s one question. You are doing better than you think. Go gently, and go again tomorrow.